(06)Desktop
Vista Rev'Up
Vista Rev’Up helps Pernod Ricard’s commercial teams plan pricing and promotions. My work was to help people decide what to do with the data, not to show more of it.
- Company
- Pernod Ricard
- Role
- Digital Product Designer
- Year
- 2021–2023
- Type
- Enterprise · Analytics · Internal Tool
01Overview
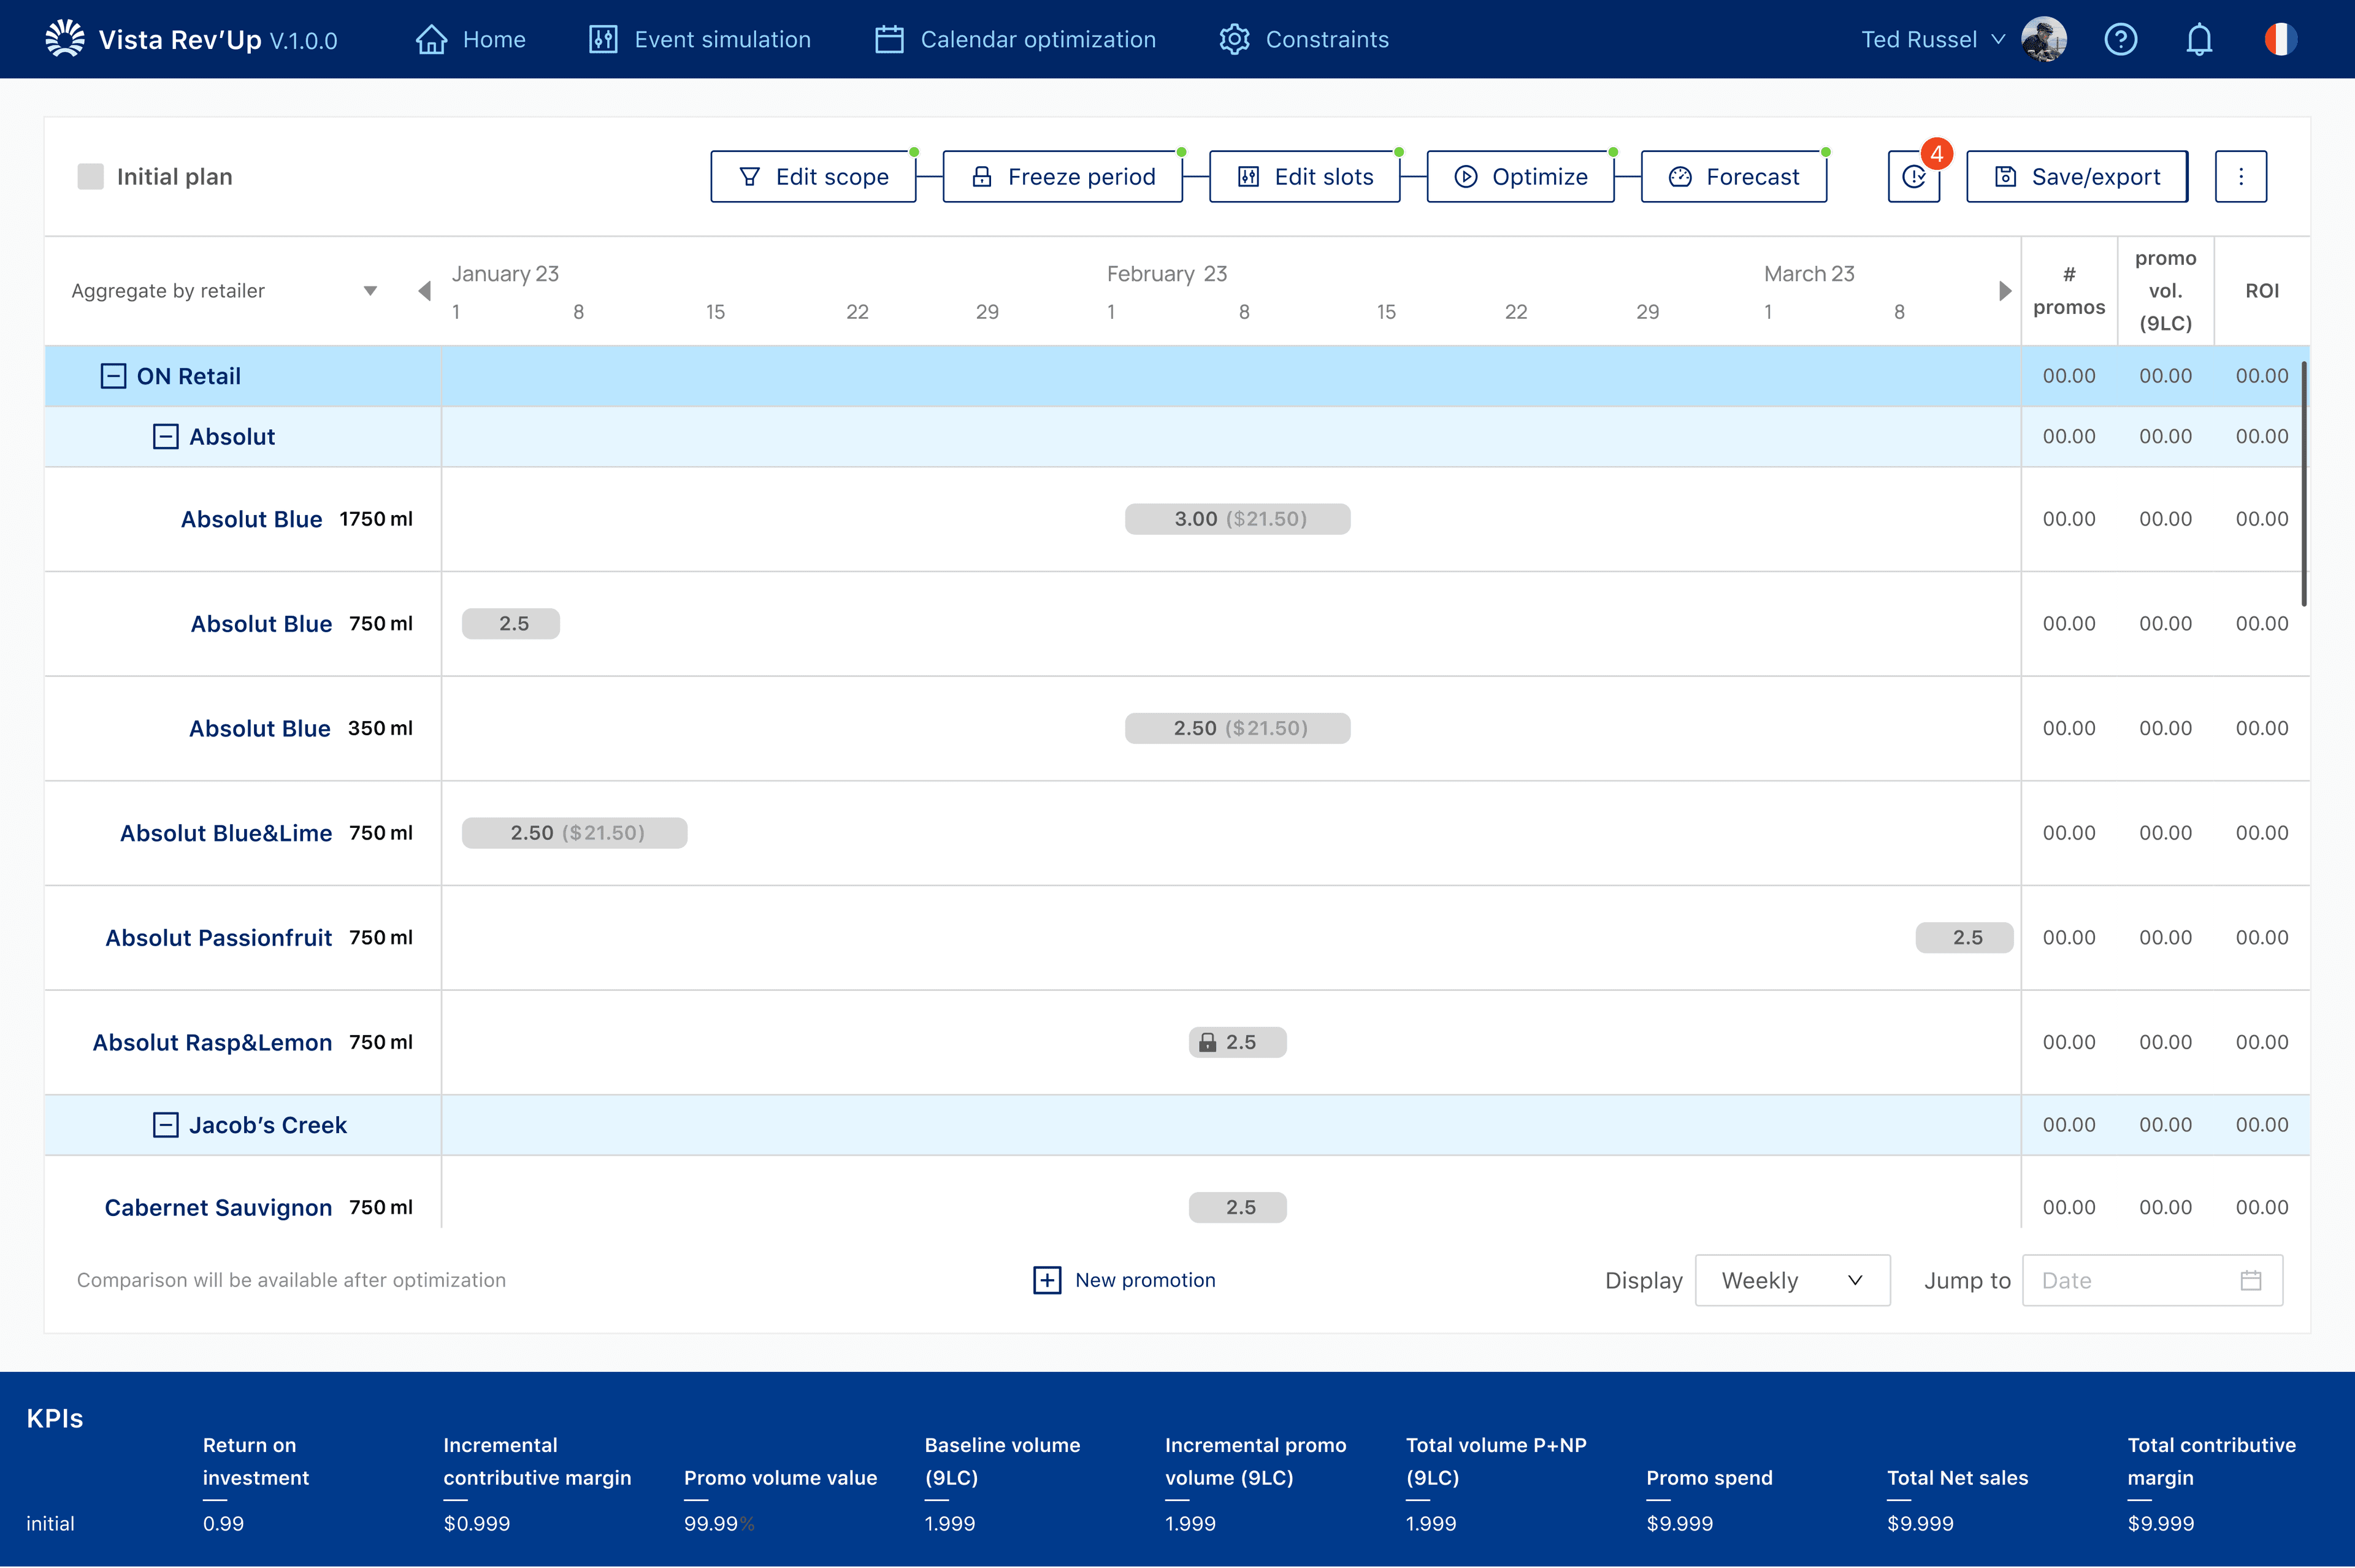
The product holds calendars, events, budgets and performance information in one place. Planning involves several connected pieces at once: what is already planned, what is changing, and what that change might do to performance.
- 35%
- First-attempt mistakes on budgeting / file upload
- 20%
- Sessions ended early
- 2.5/5
- Input-panel usability rating
Research findings that framed the problem, not results.
02My role
Digital Product Designer
- Flows for loading plans, editing scope and editing promotions
- Hierarchy for calendars, events and KPIs
- Iterating with 3+ rounds of usability testing
- Using Archipelago components in the product
03The challenge
Each field and metric made sense on its own. Together they competed for attention. Knowing something was wrong wasn’t the same as knowing what to do, and the interface had to make the next decision available at the moment it was needed.
- 01Mistakes on the first attempt at budgeting and upload
- 02Sessions ending before the work was finished
- 03Commercial complexity that can’t be hidden
04Approach
4.1
From a file to a decision on the calendar
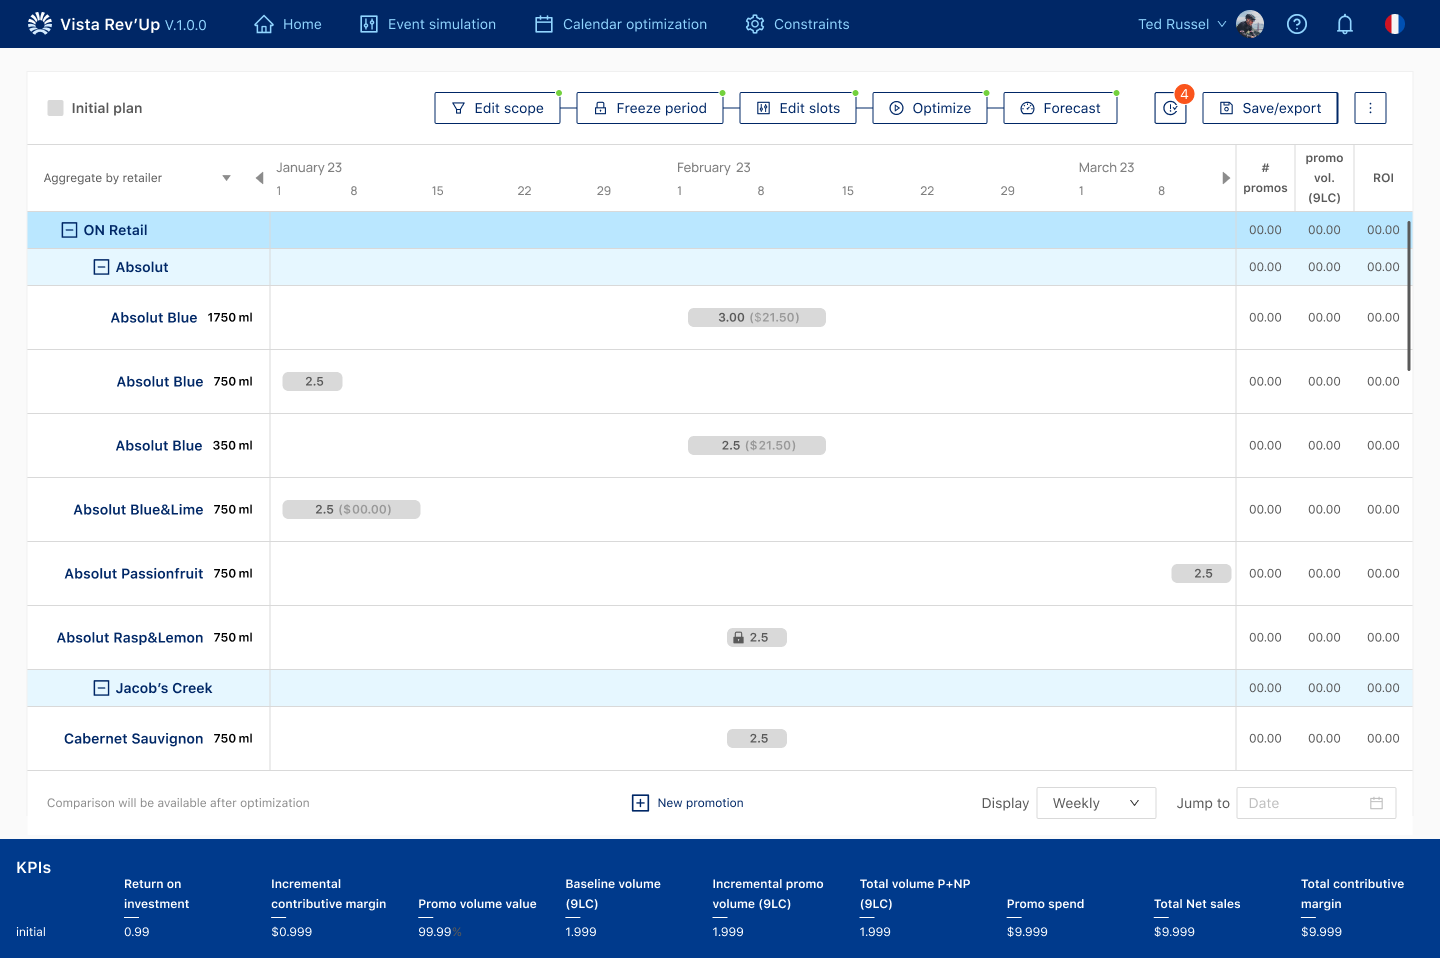
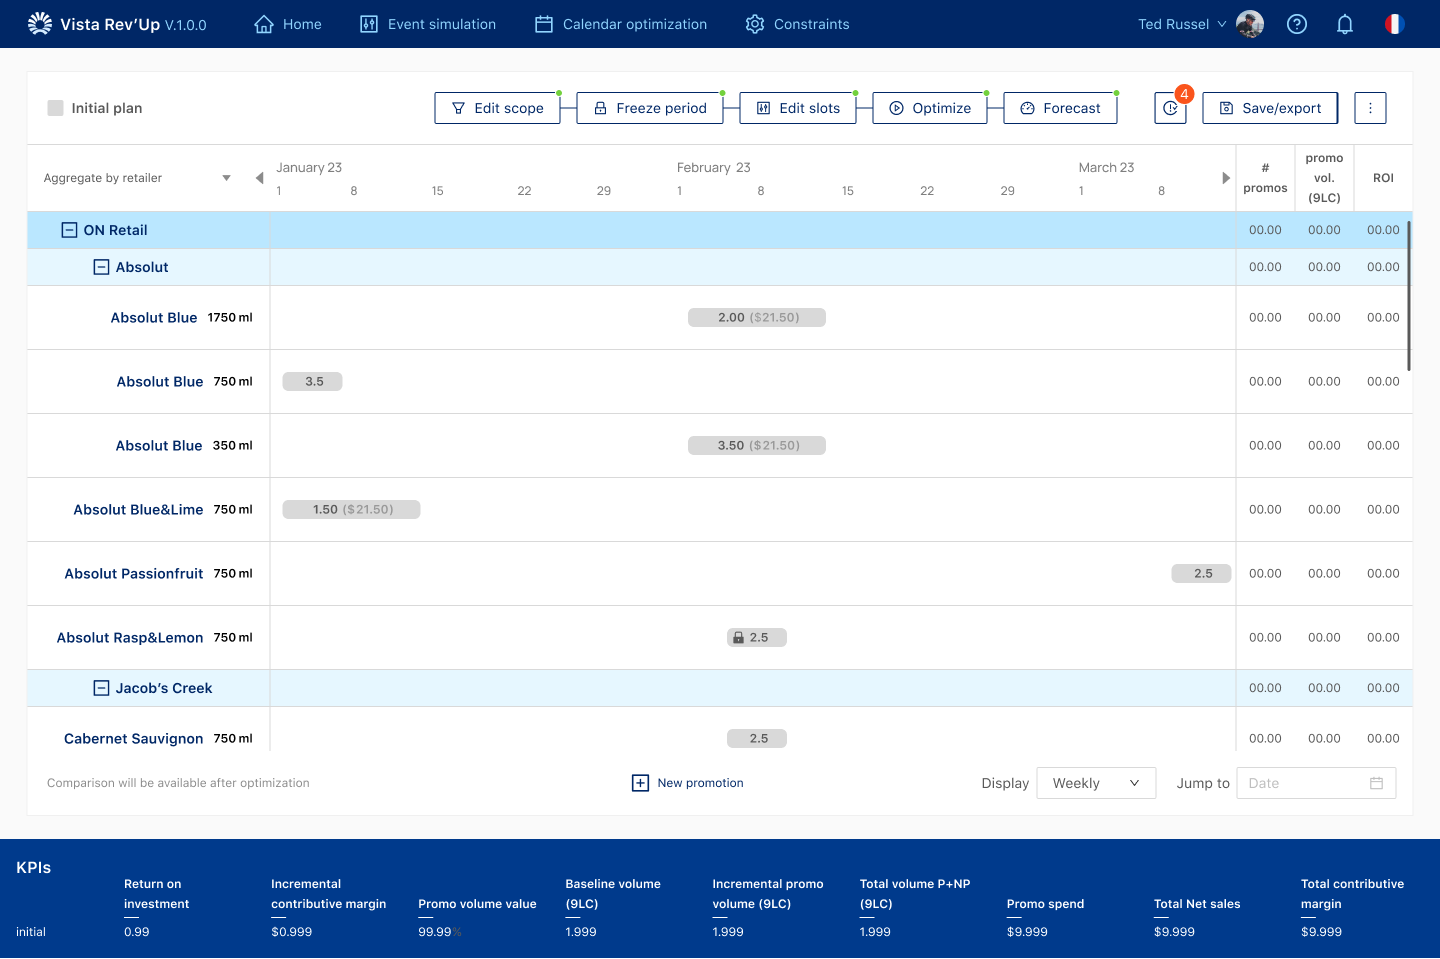
Rev’Up is where commercial teams plan pricing and promotions. A plan is uploaded, the product forecasts, and the calendar shows what is already planned. From there a person can narrow the scope, edit a promotion, compare the new scenario with the old one, and read the KPI change.
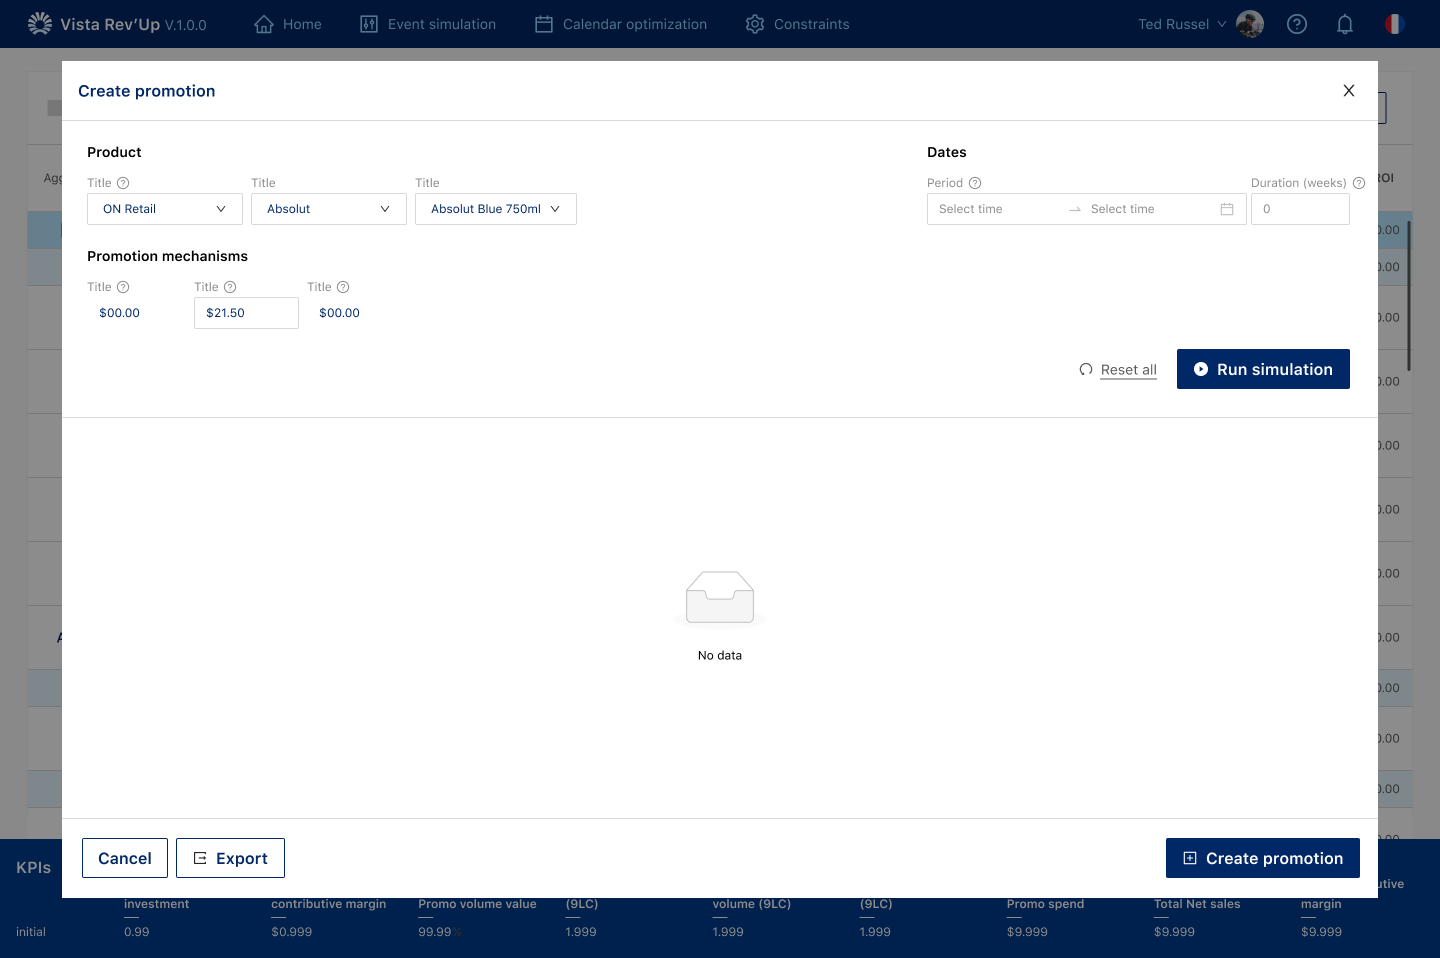
Around that path: a breakdown of KPIs by retailer, brand and product, a way to create a promotion and run a simulation, and a notification when an optimisation is ready to review. The screens use Archipelago components.
05Key flows
5.1
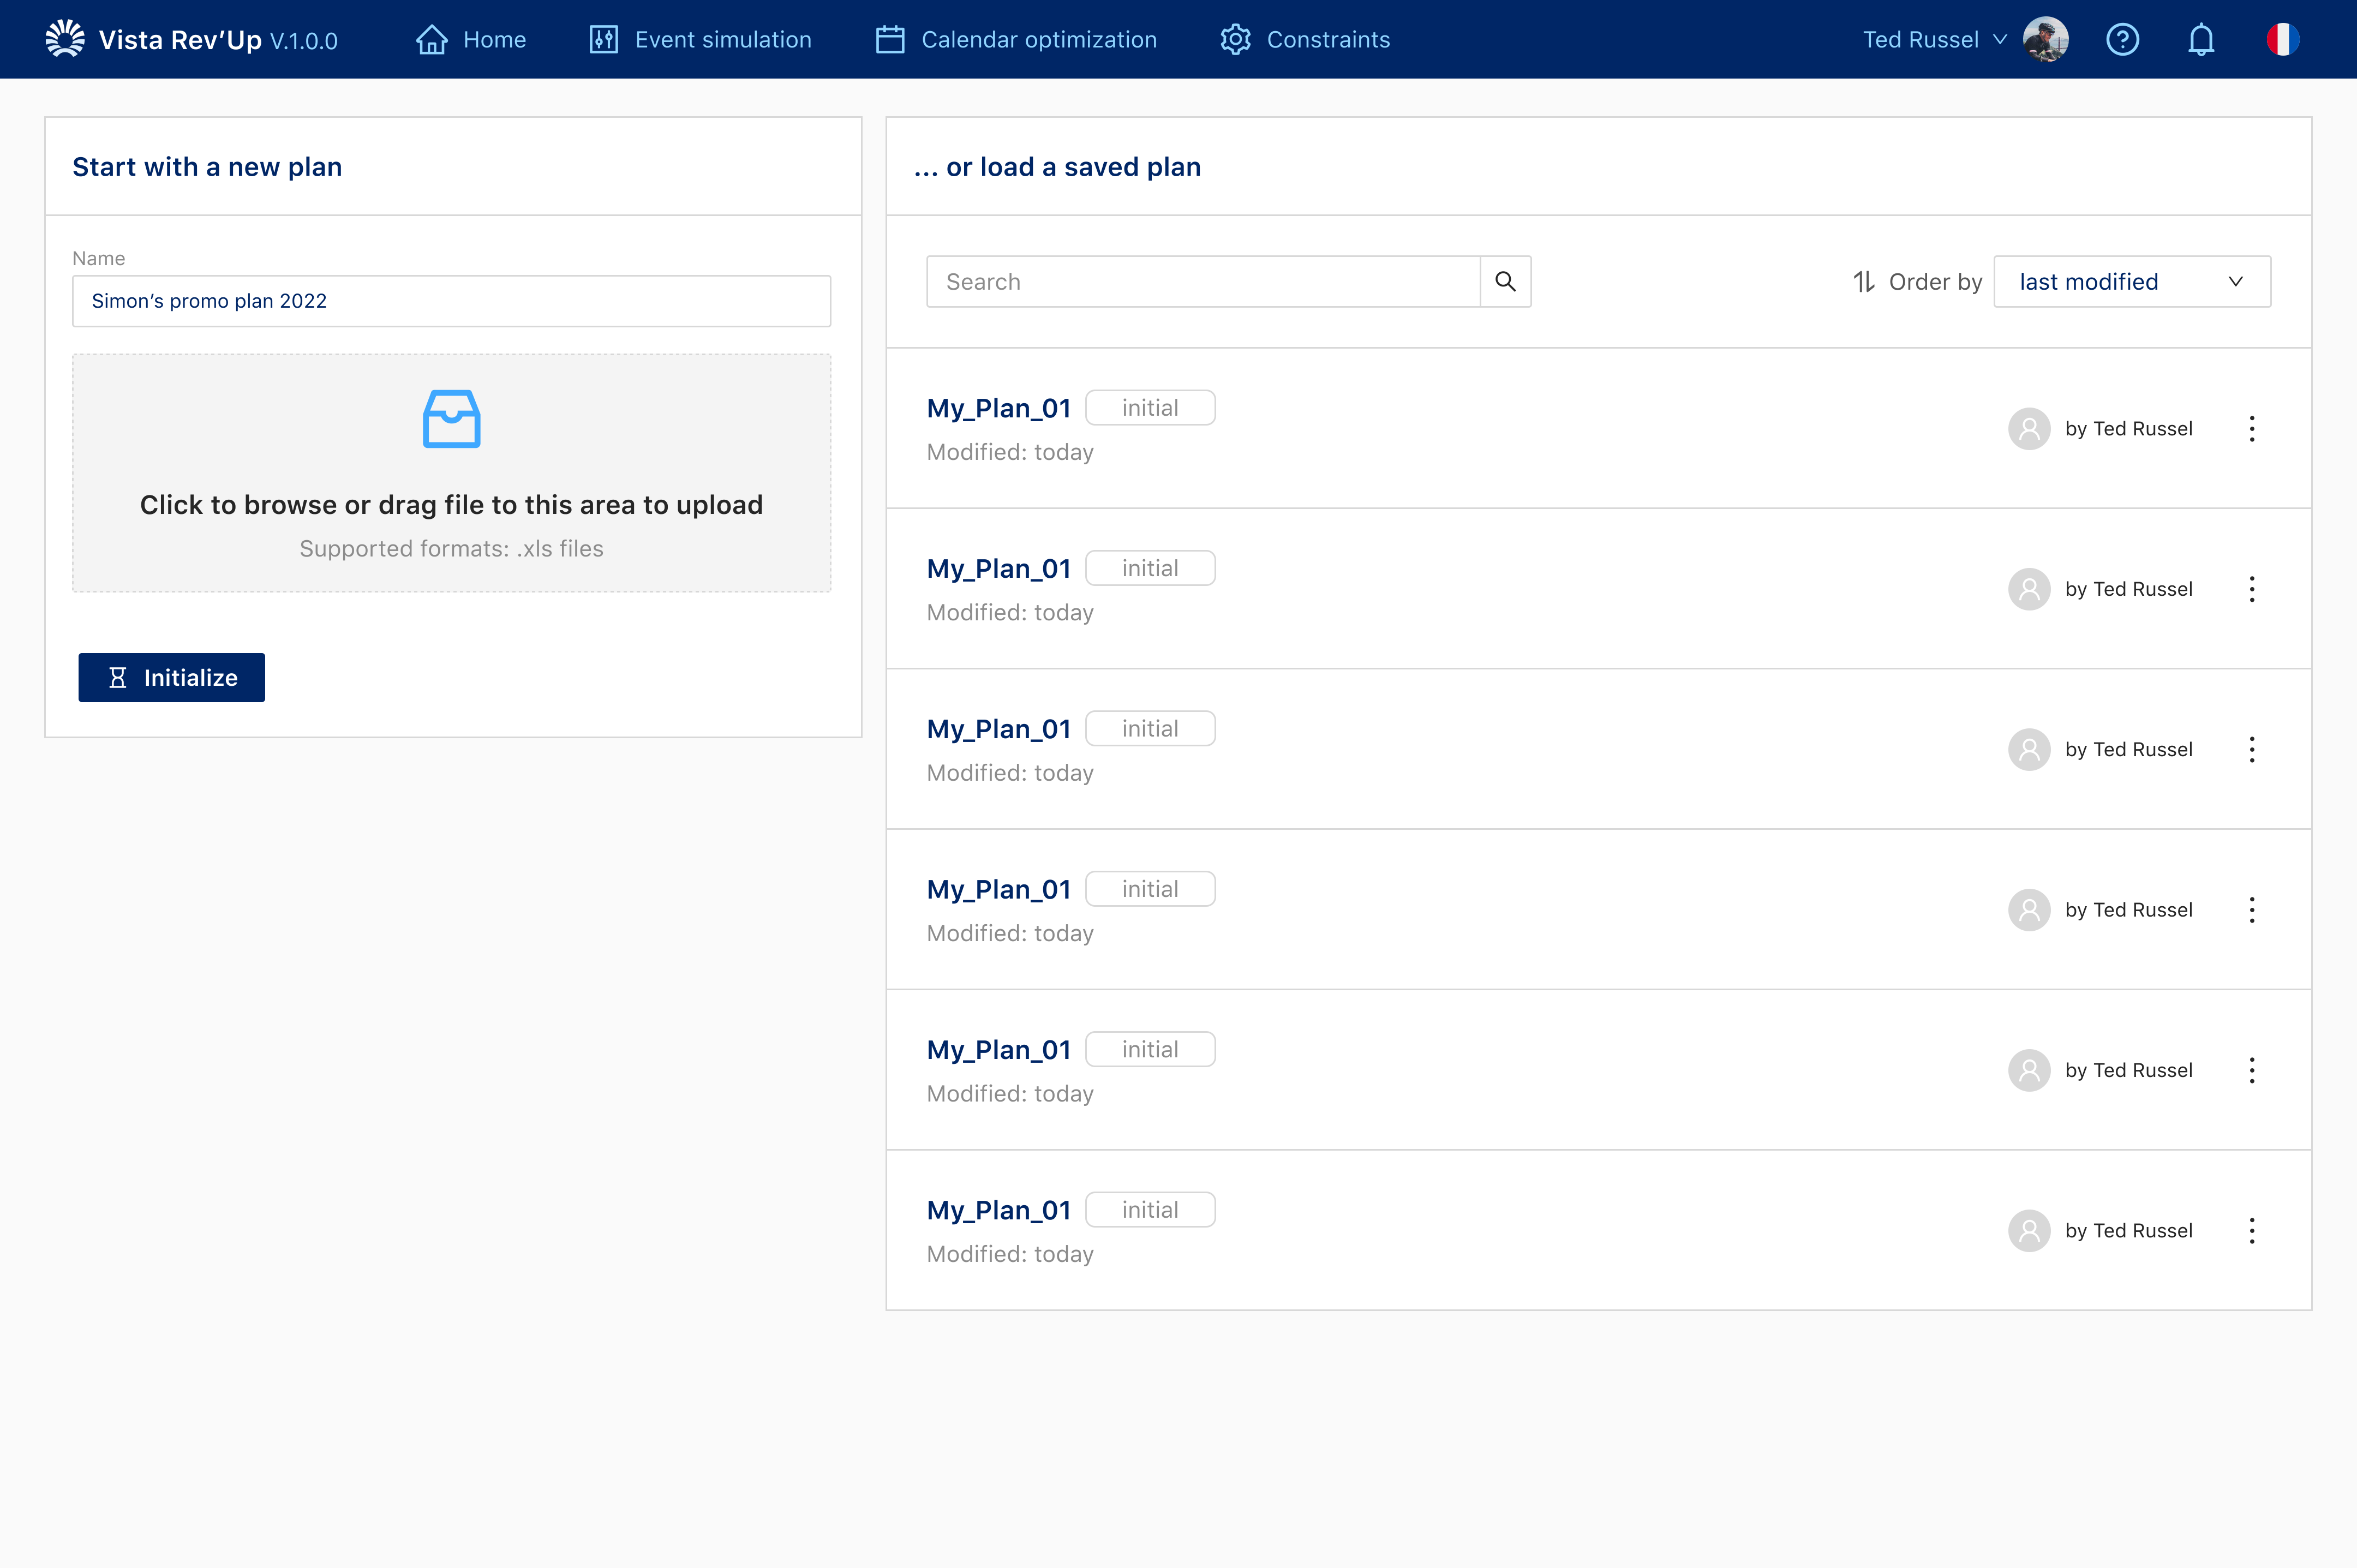
Loading a plan
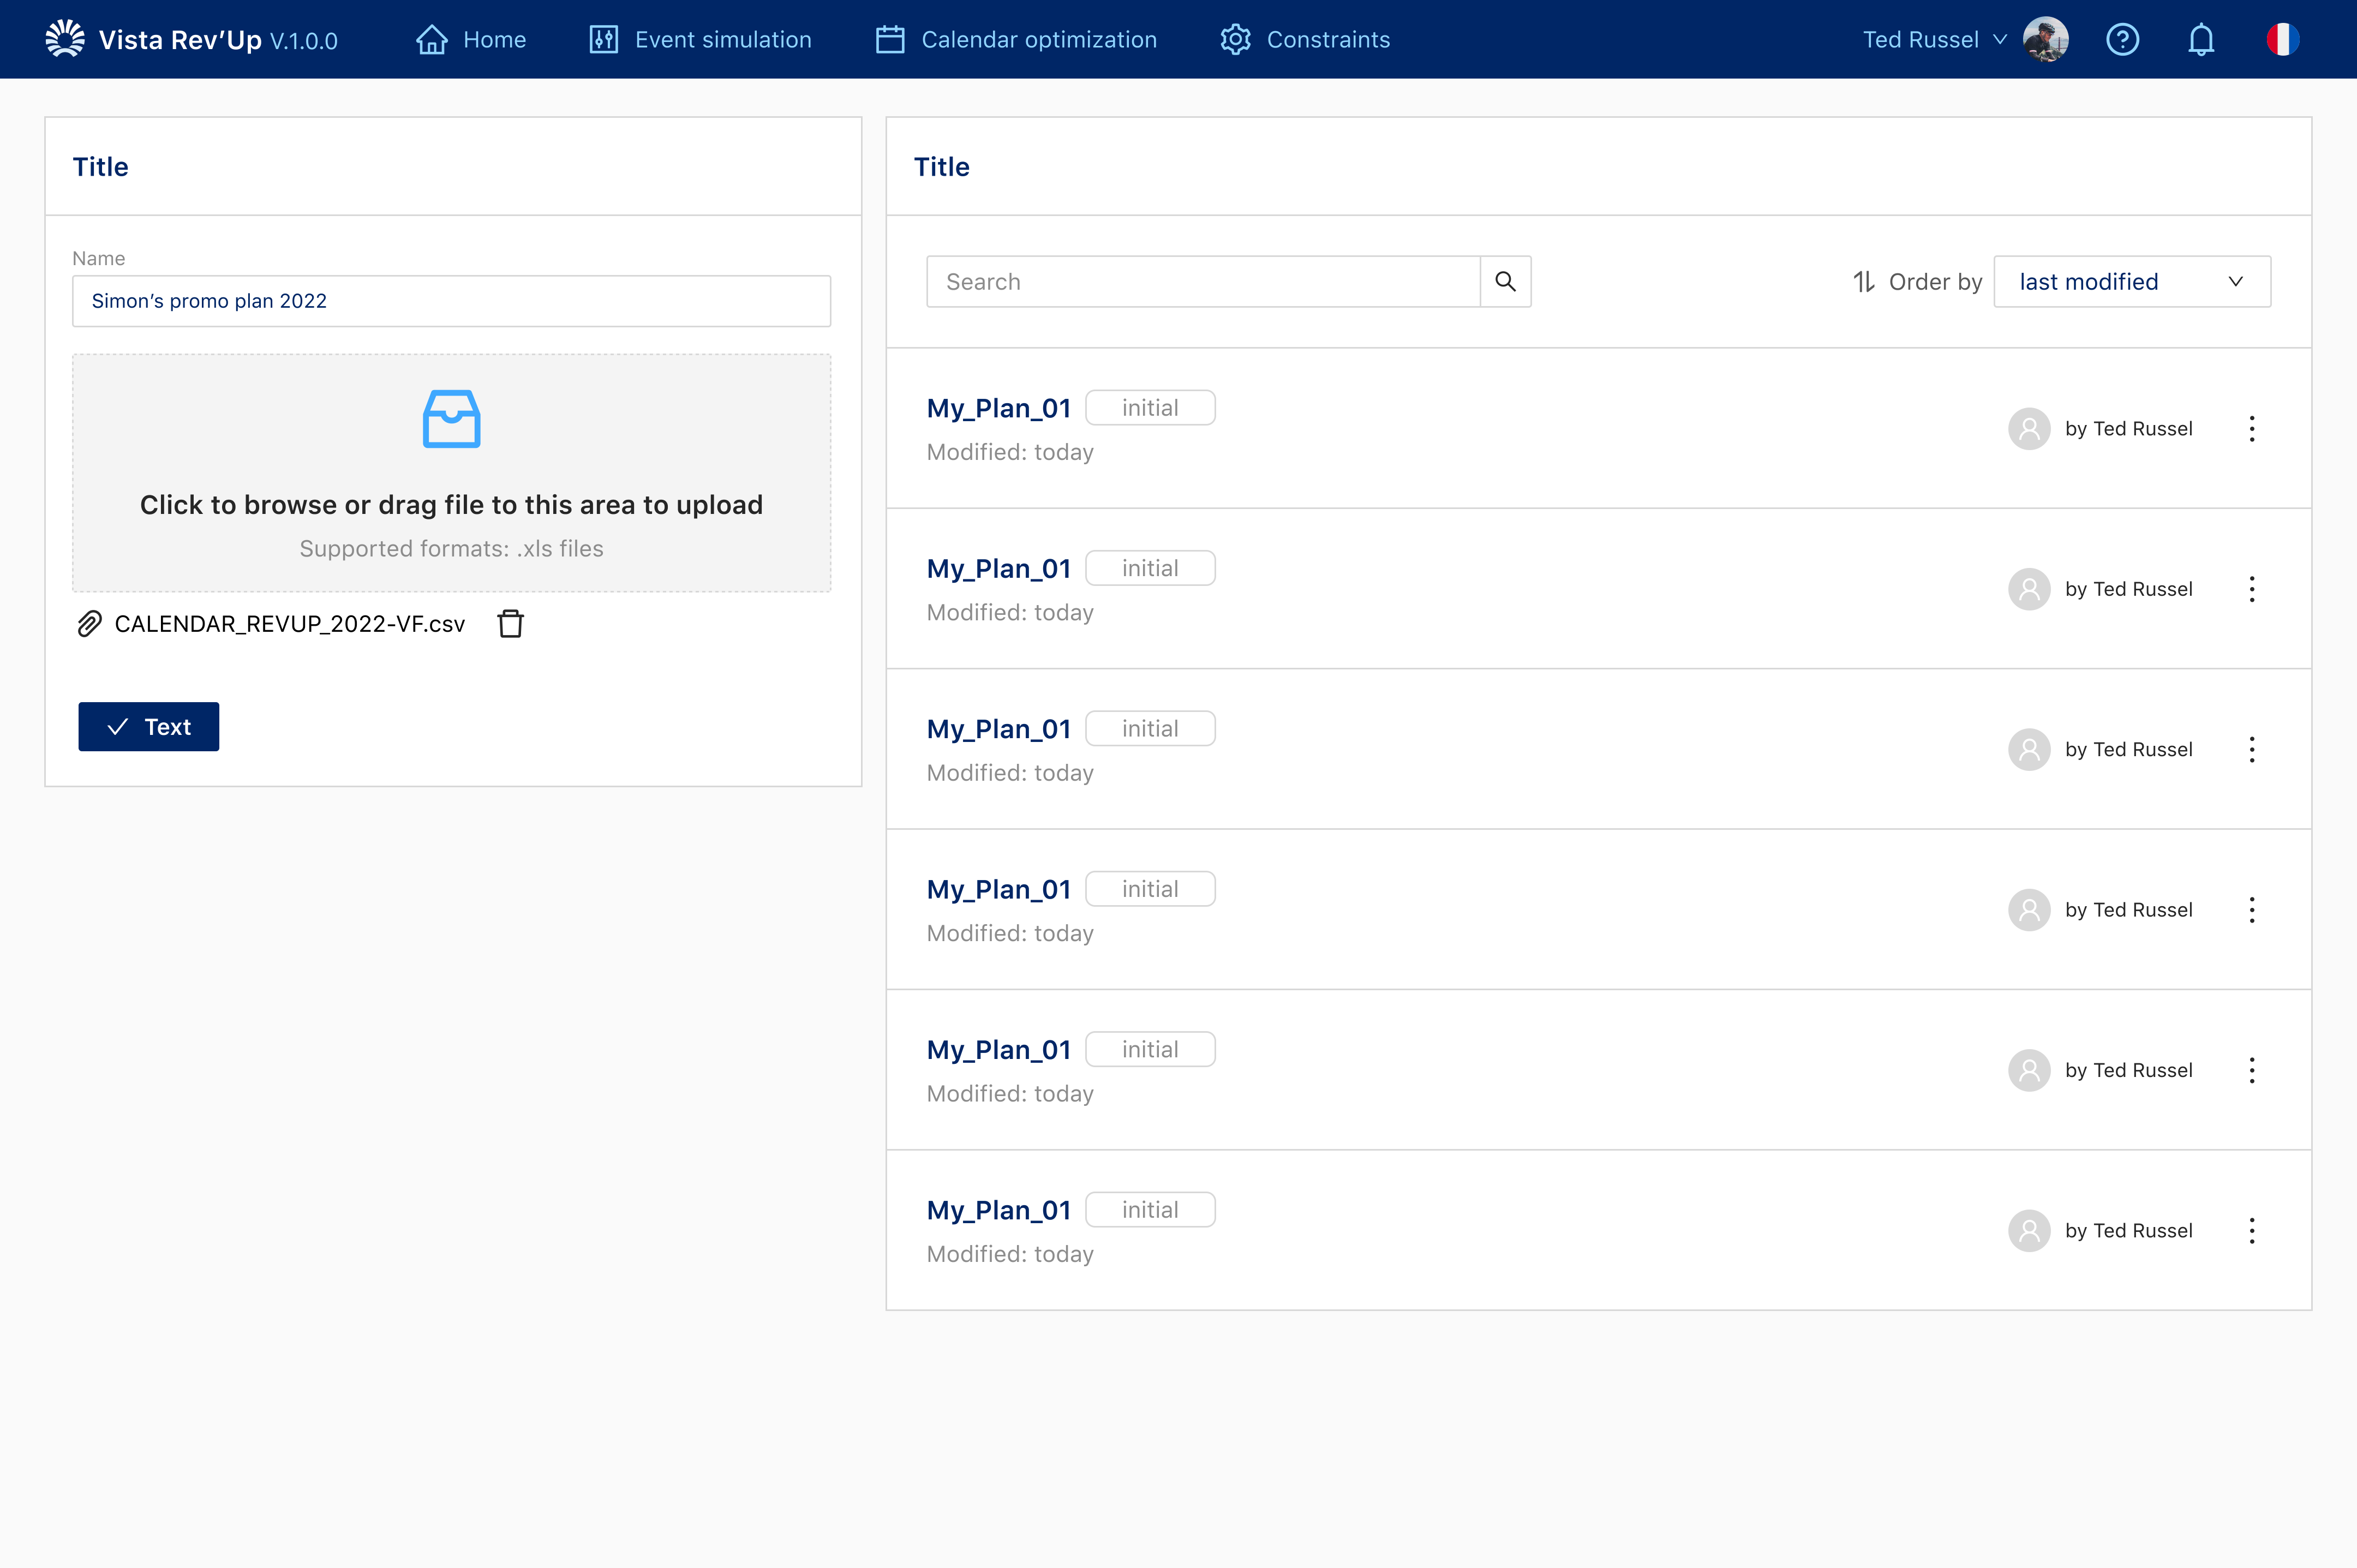
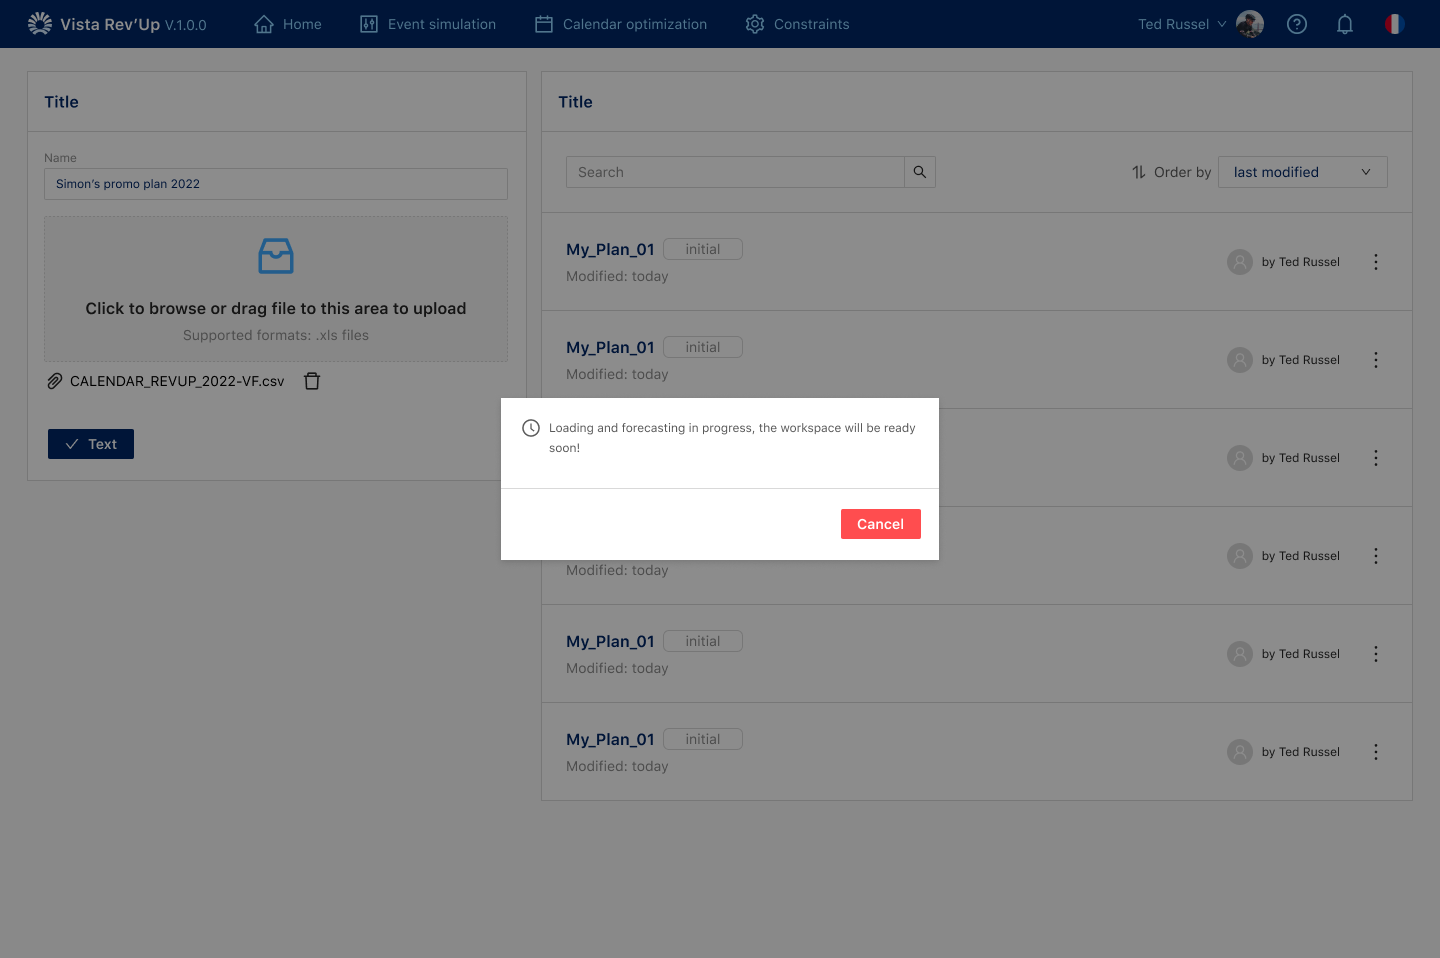
A plan is uploaded through the file manager, and the product says clearly that it is loading and forecasting.
- 1Open the file manager
- 2Attach the file
- 3Loading and forecasting
5.2
Editing the scope
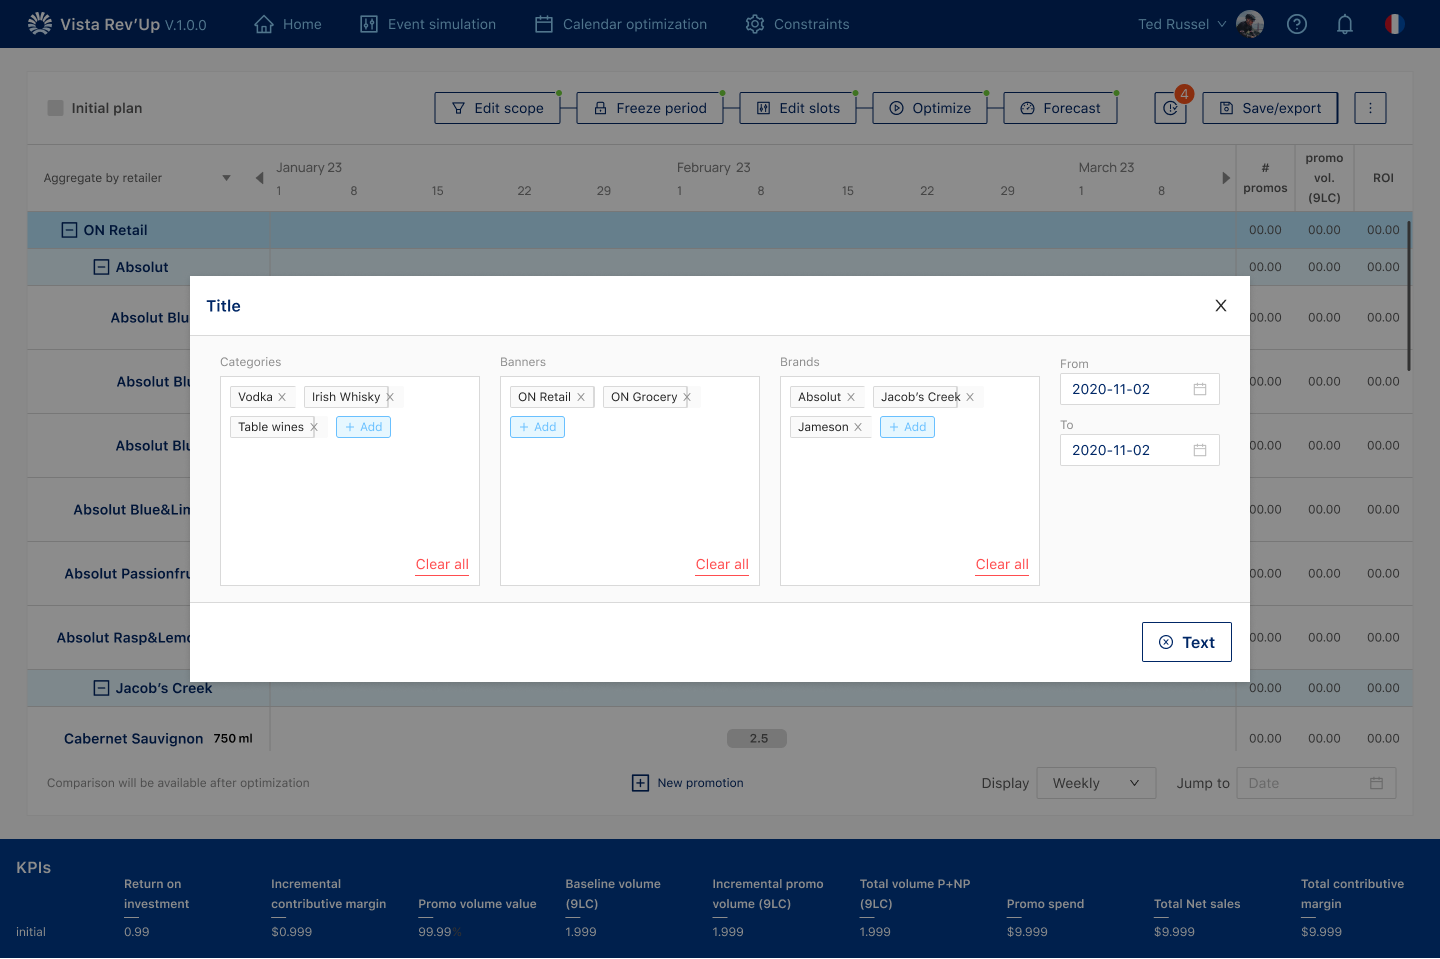
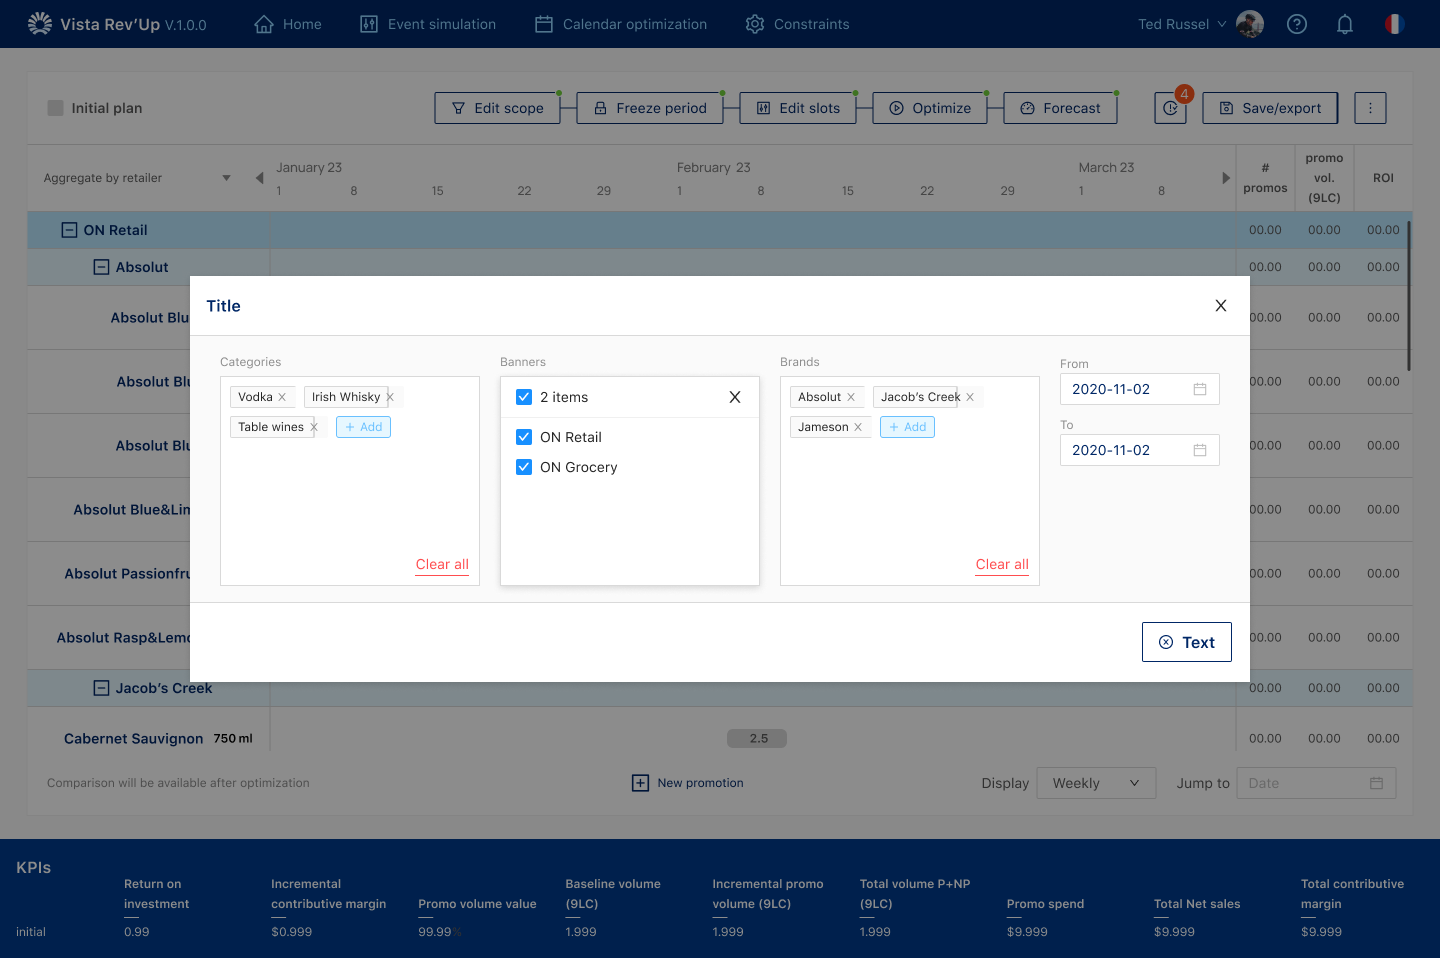
Categories, banners and brands are removable chips in a modal, and the calendar updates to the remaining product lines.
- 1Open Edit scope
- 2Choose banners
- 3Narrow the scope
- 4See the calendar update
5.3
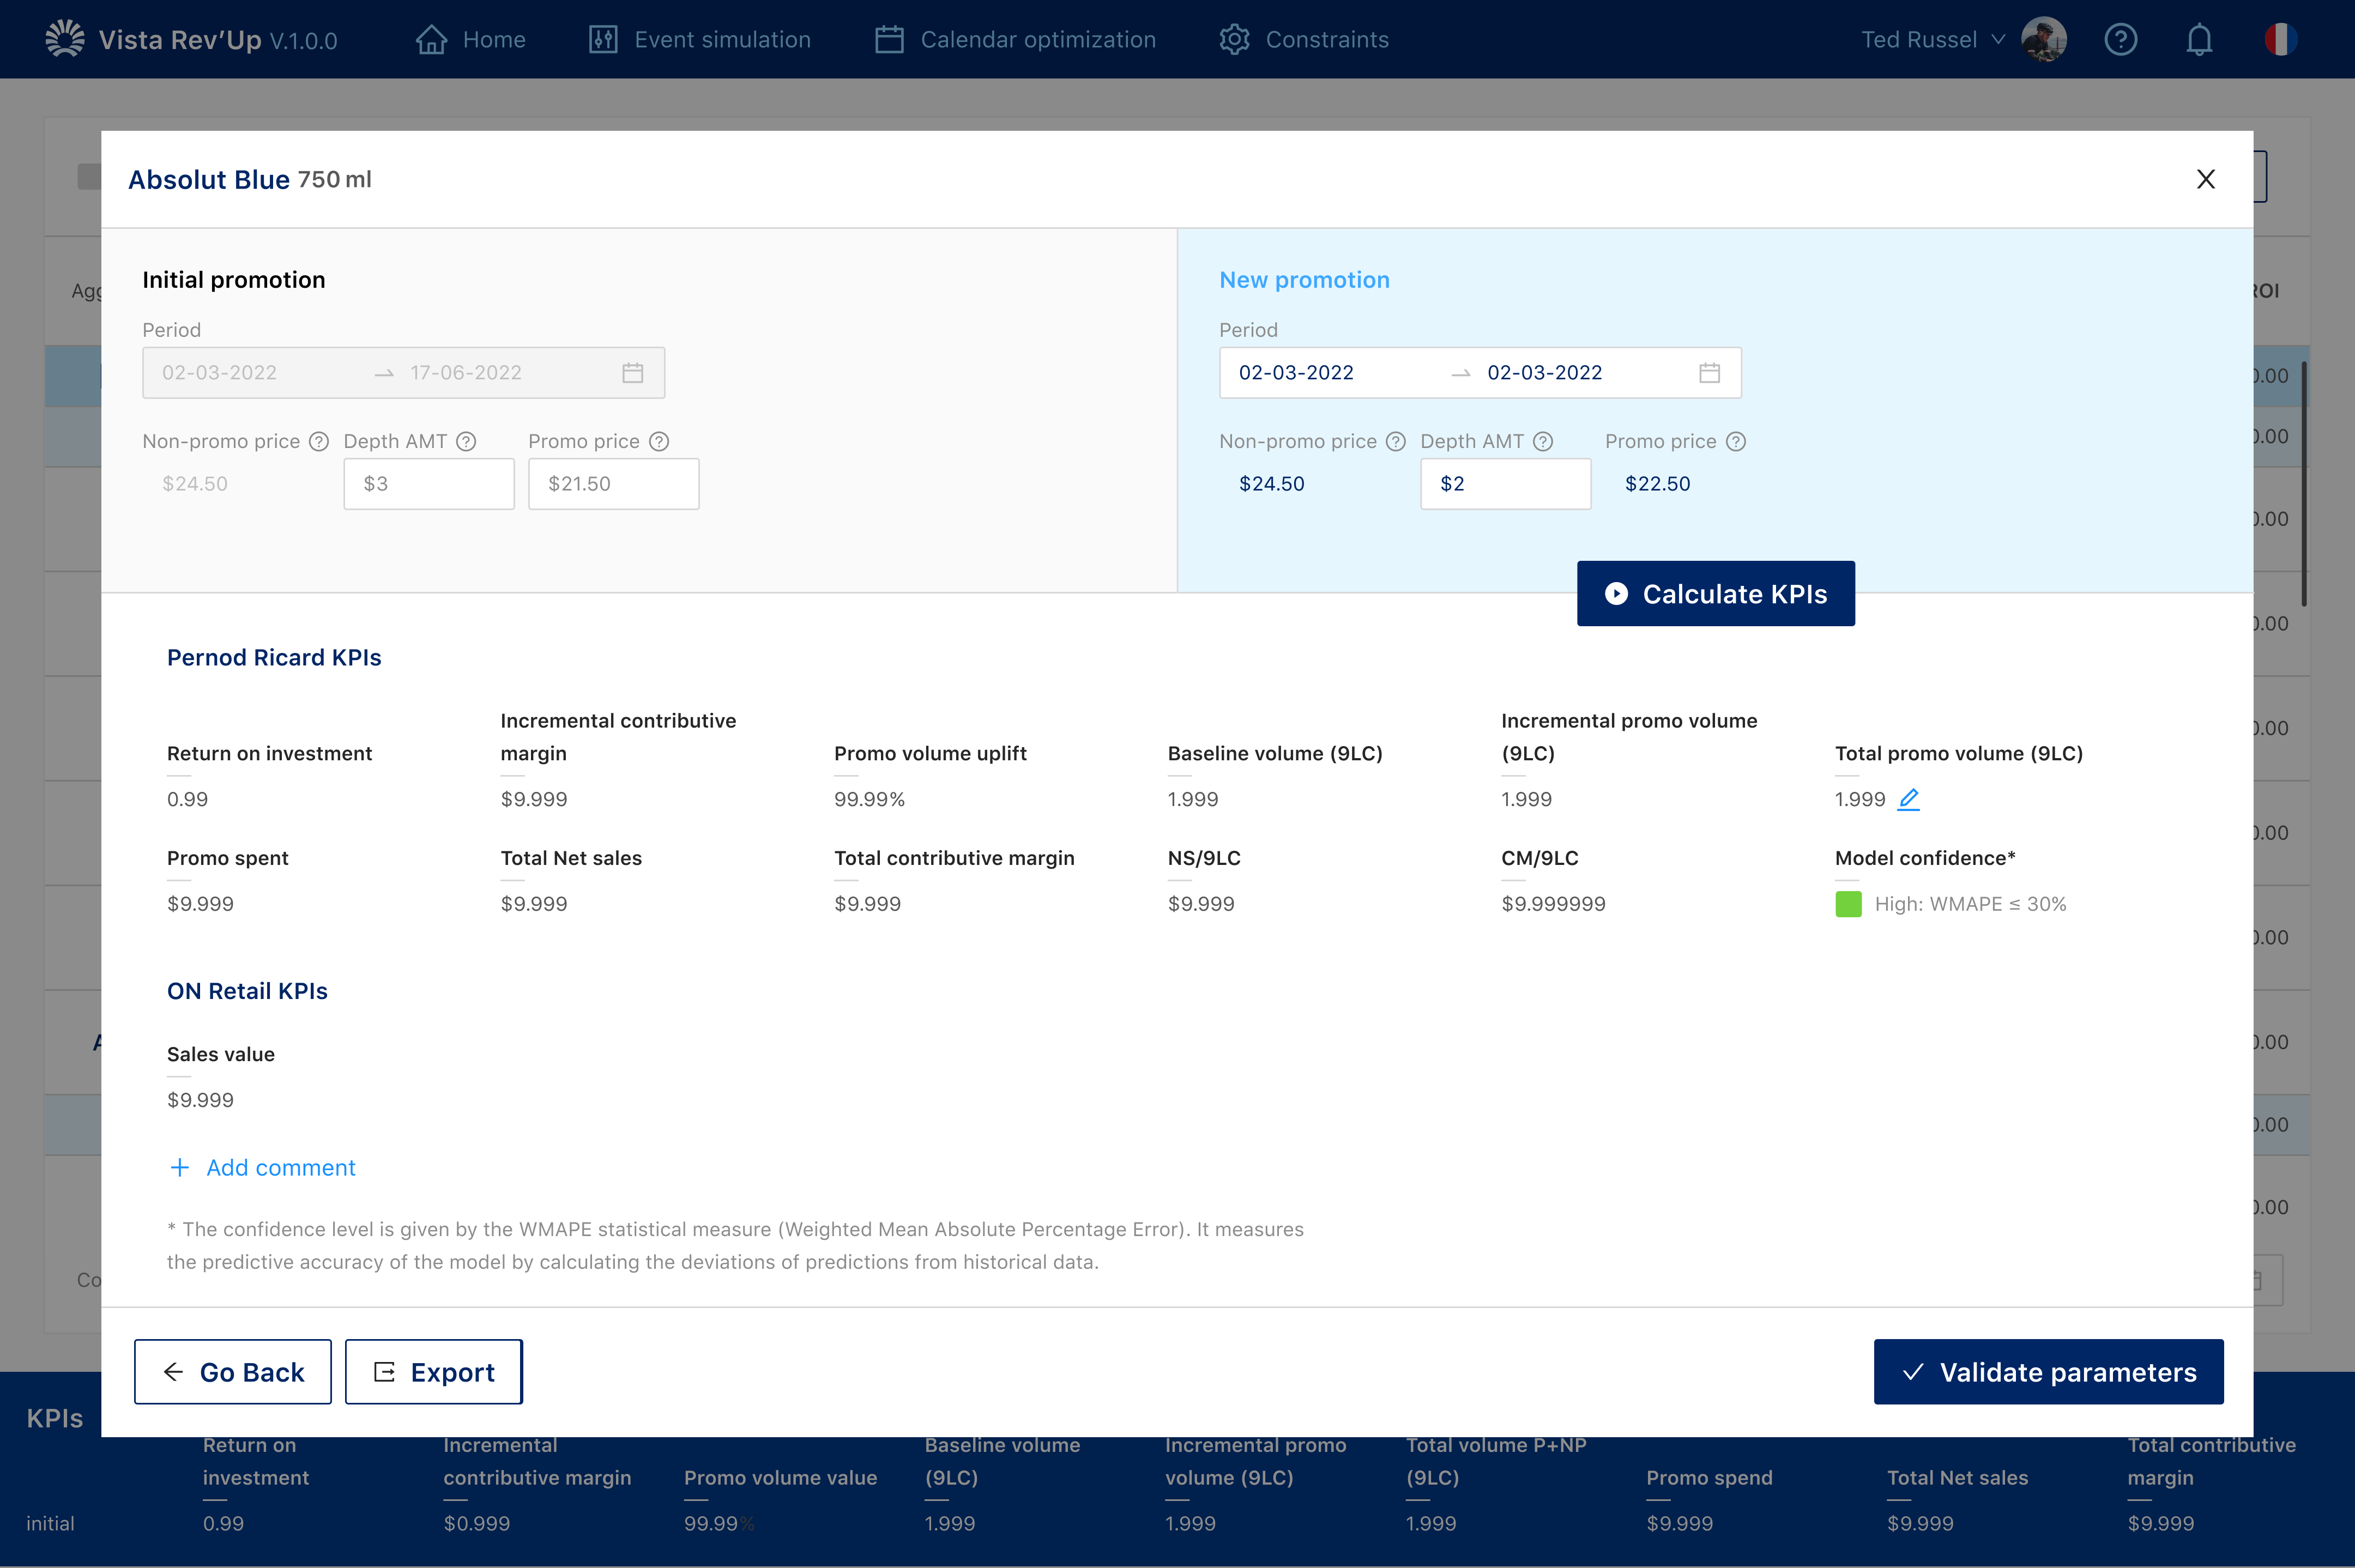
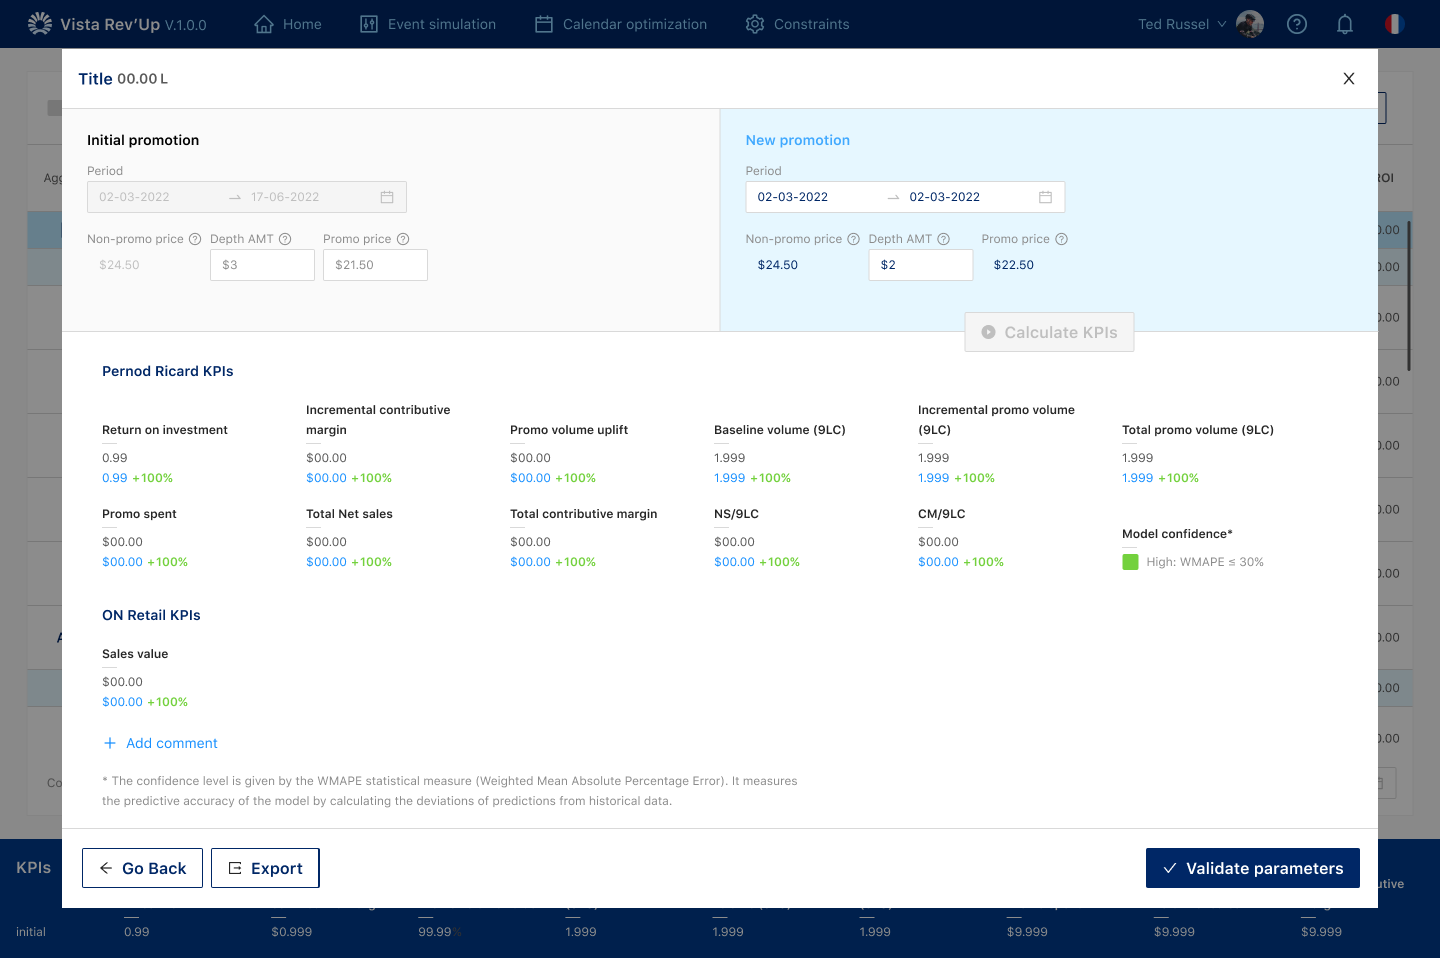
Editing a promotion
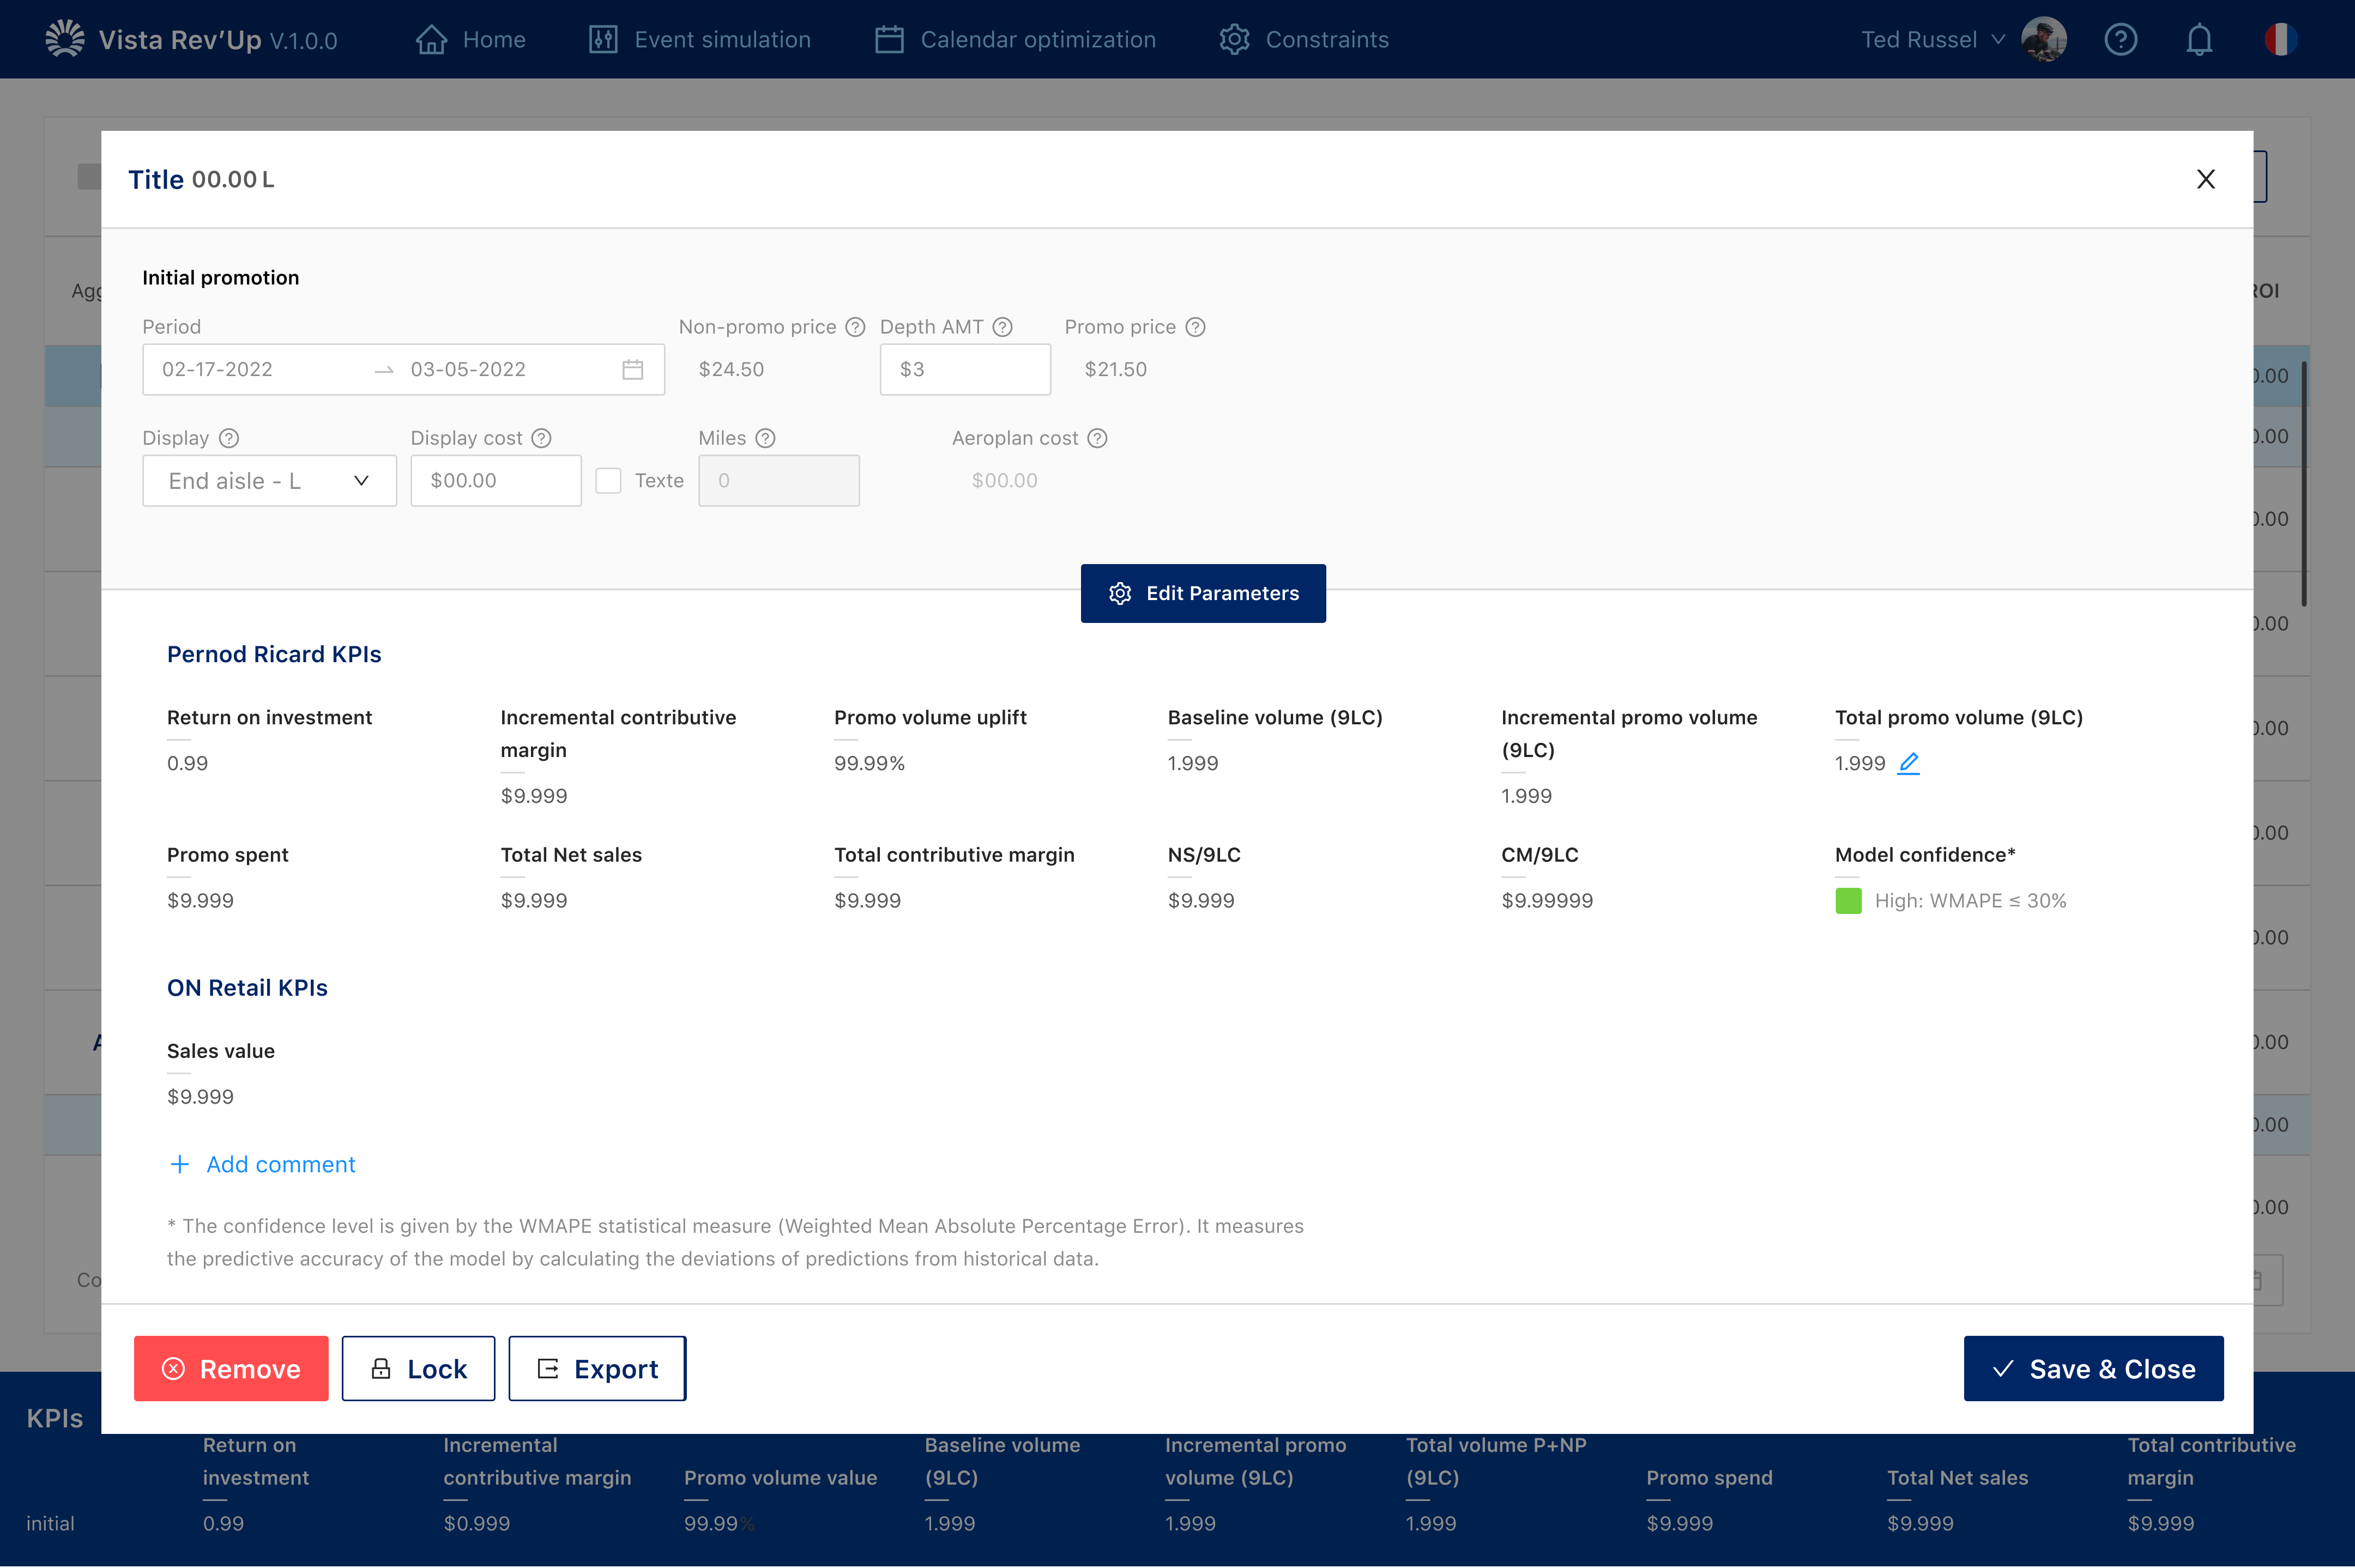
The new scenario is shown side by side with the initial promotion, with KPI changes and model confidence.
- 1Open promo details
- 2Edit the promo
- 3Compare the new scenario
- 4Calendar updated
 Open full size
 Open full size
 Open full size
 Open full size
5.4
KPIs and notifications
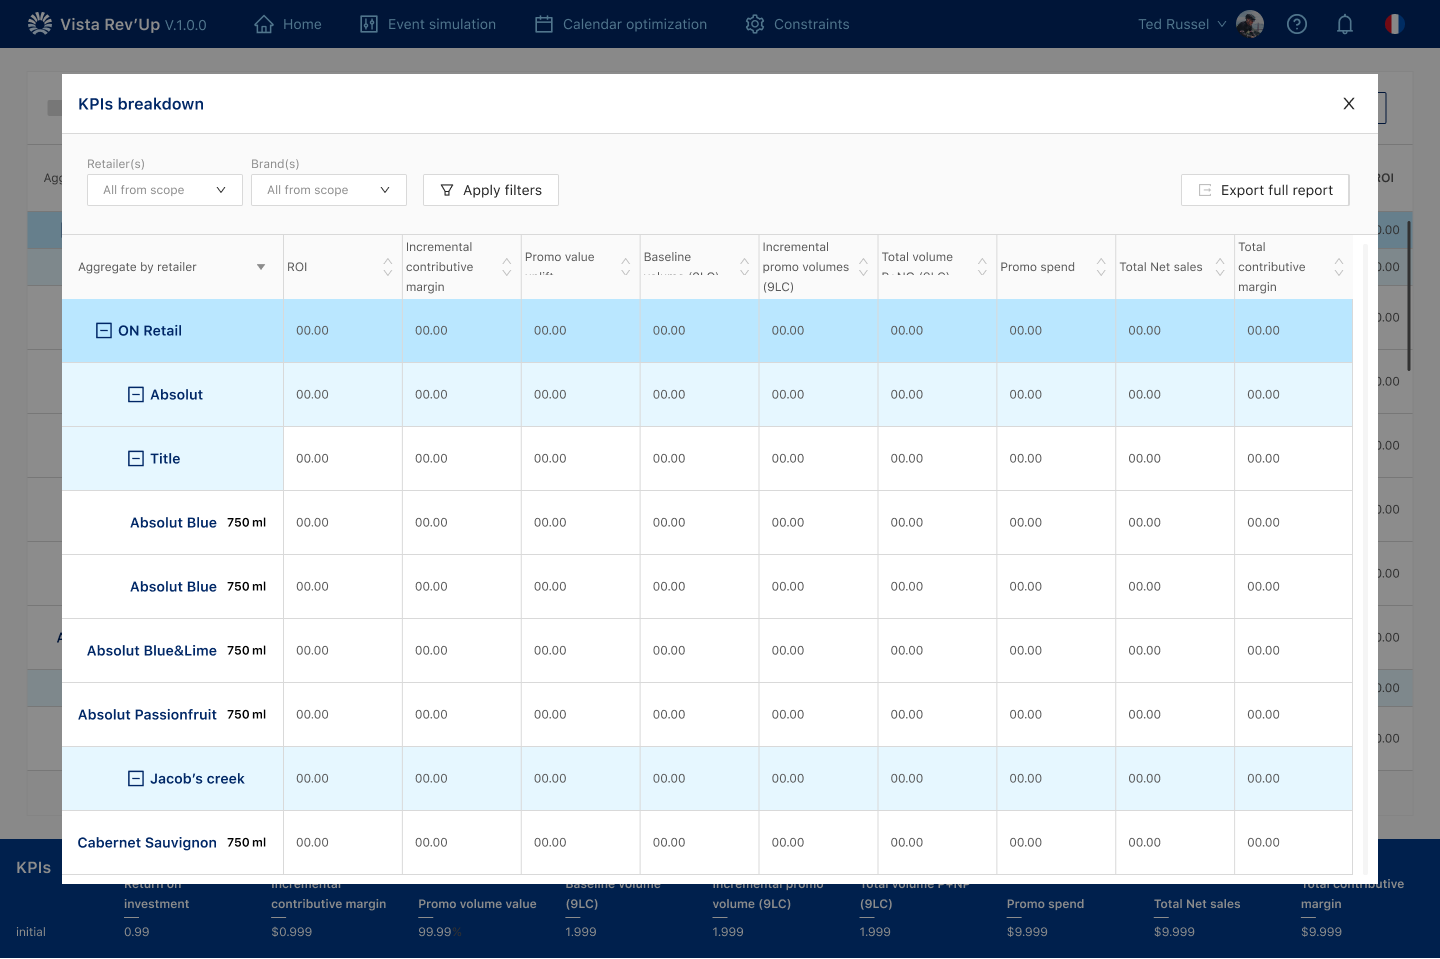
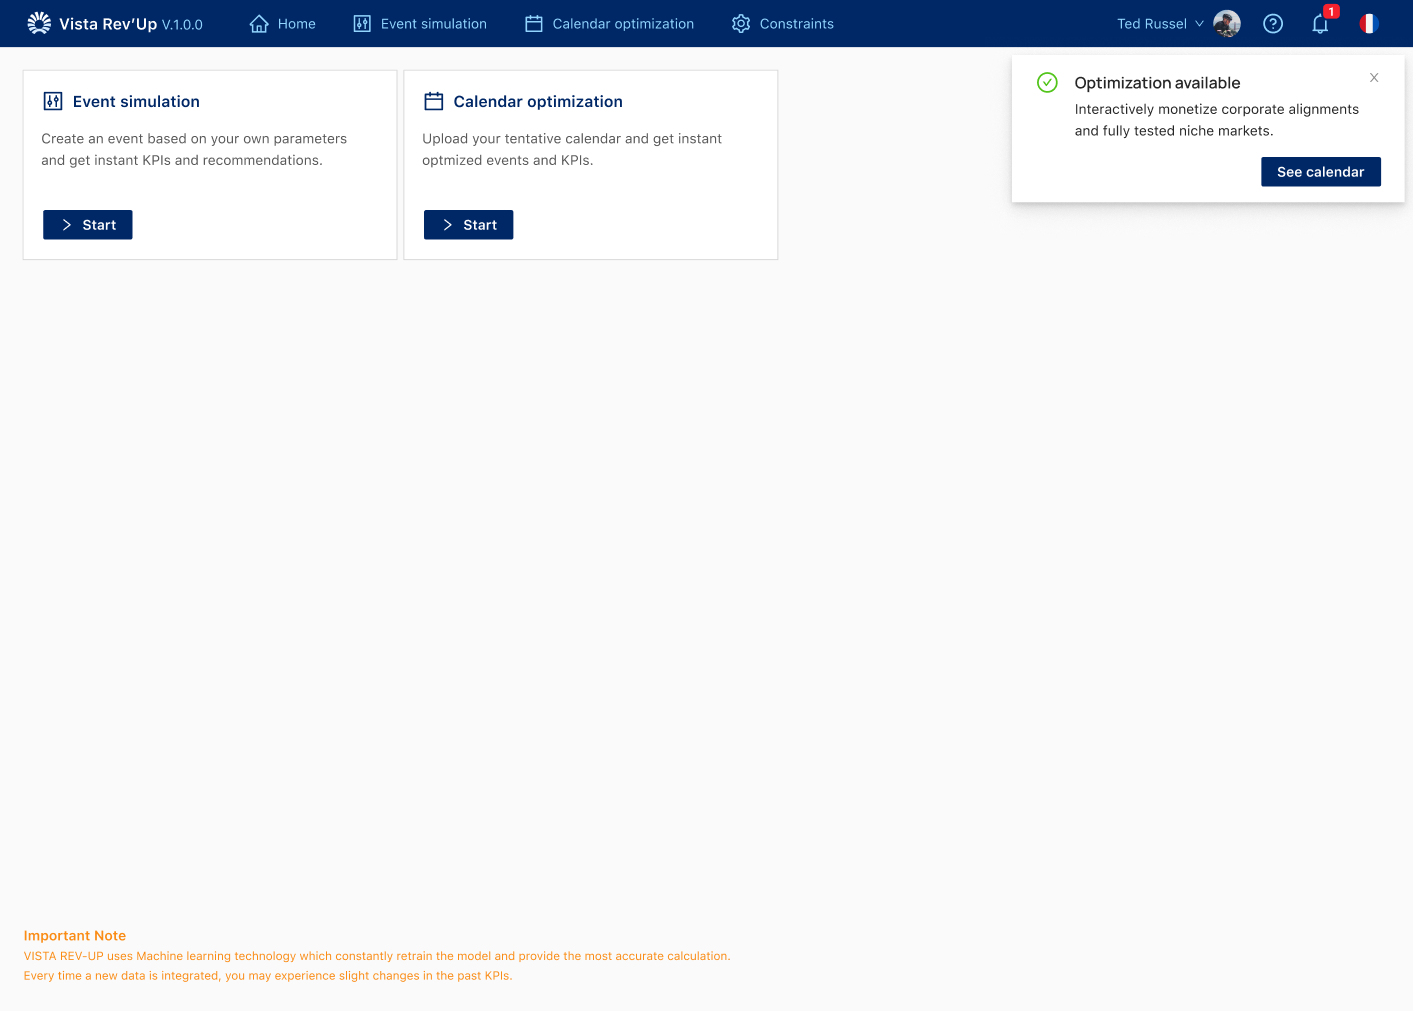
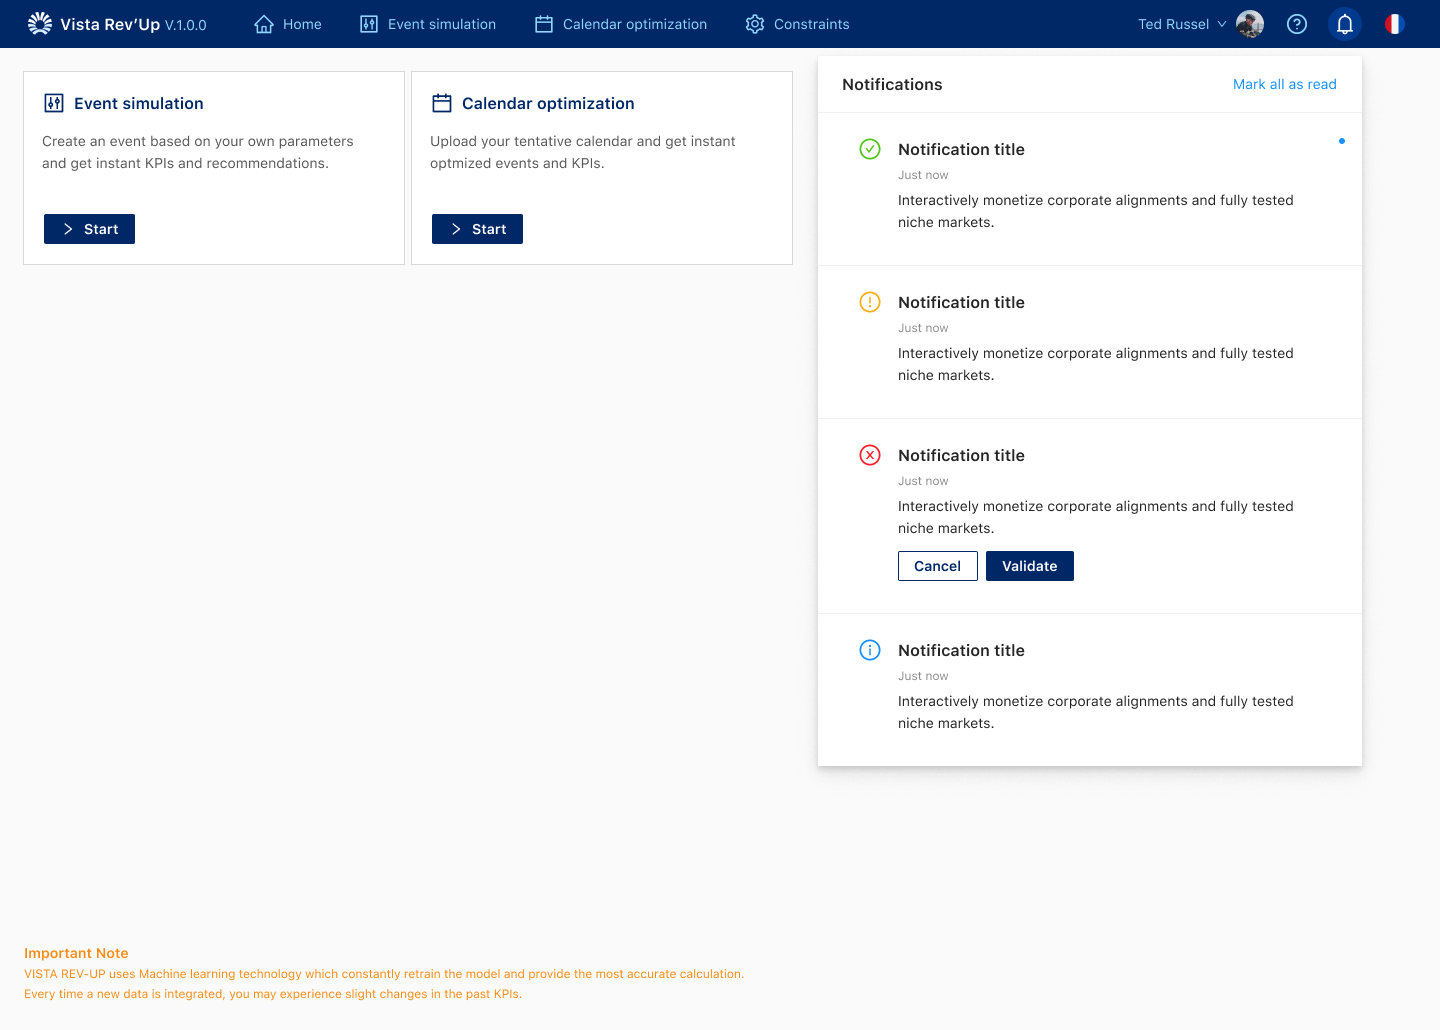
A KPI breakdown by retailer, brand and product sits one menu away, and a notification says when an optimisation is ready to review.
 Open full size
 Open full size
 Open full size
 Open full size
06Design decisions
Actions next to the data
Actions sit with the information they affect.
Levels of attention
Some numbers are compared, some scanned, some only matter once a decision has started.
Side-by-side scenarios
A change is always read against what was there before.
Visibility vs focus
Versions balanced what is shown immediately and what sits behind an interaction.
07Outcome
The product kept its depth. What changed was the order in which that depth appears: context first, then the decision, then the detail needed to act. The tool supports expert judgment rather than replacing it.