Designing better decisions from complex commercial data.
An internal pricing and promotion tool used by commercial teams to plan and evaluate promotional activity.
- Pernod Ricard
- Digital Product Designer
- 2021–2023
- Enterprise · Analytics · Internal Tool
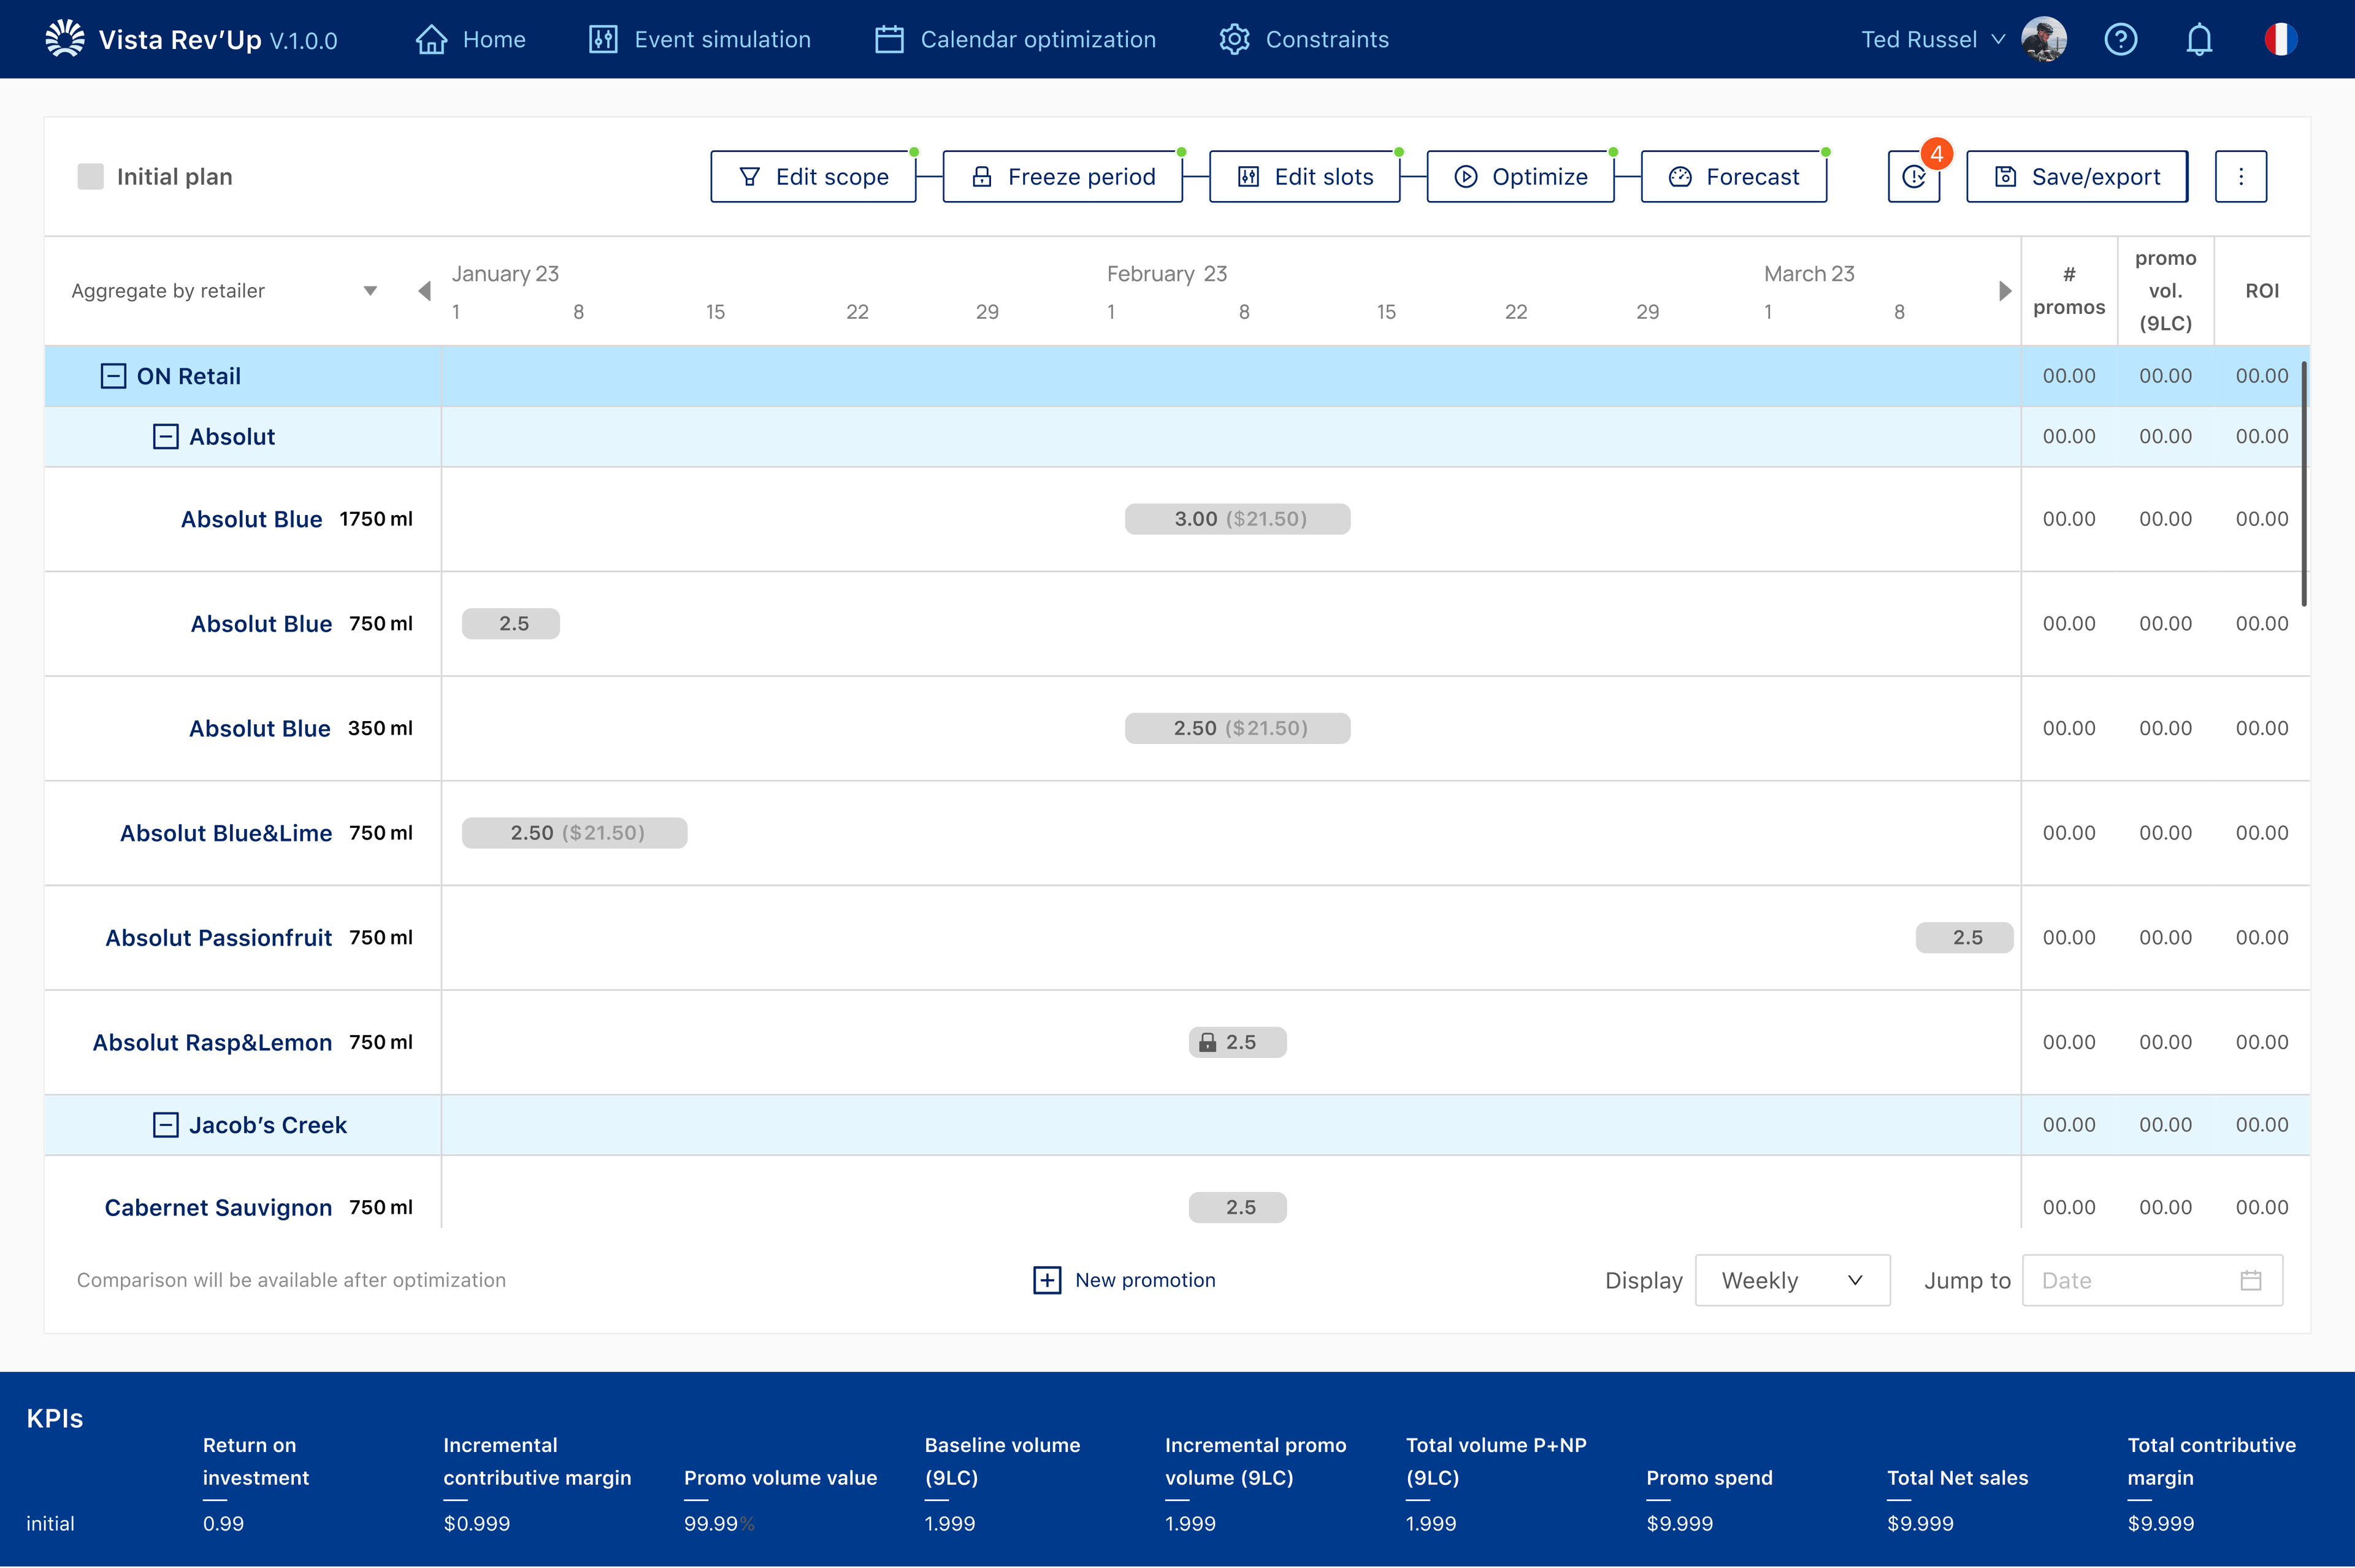
Turning commercial data into decisions.
Vista Rev'Up is used by commercial teams at Pernod Ricard to plan pricing and promotional activity.
The product holds calendars, events, budgets and performance information in one place. The work was not to display more of that information. It was to help people decide what to do with it.
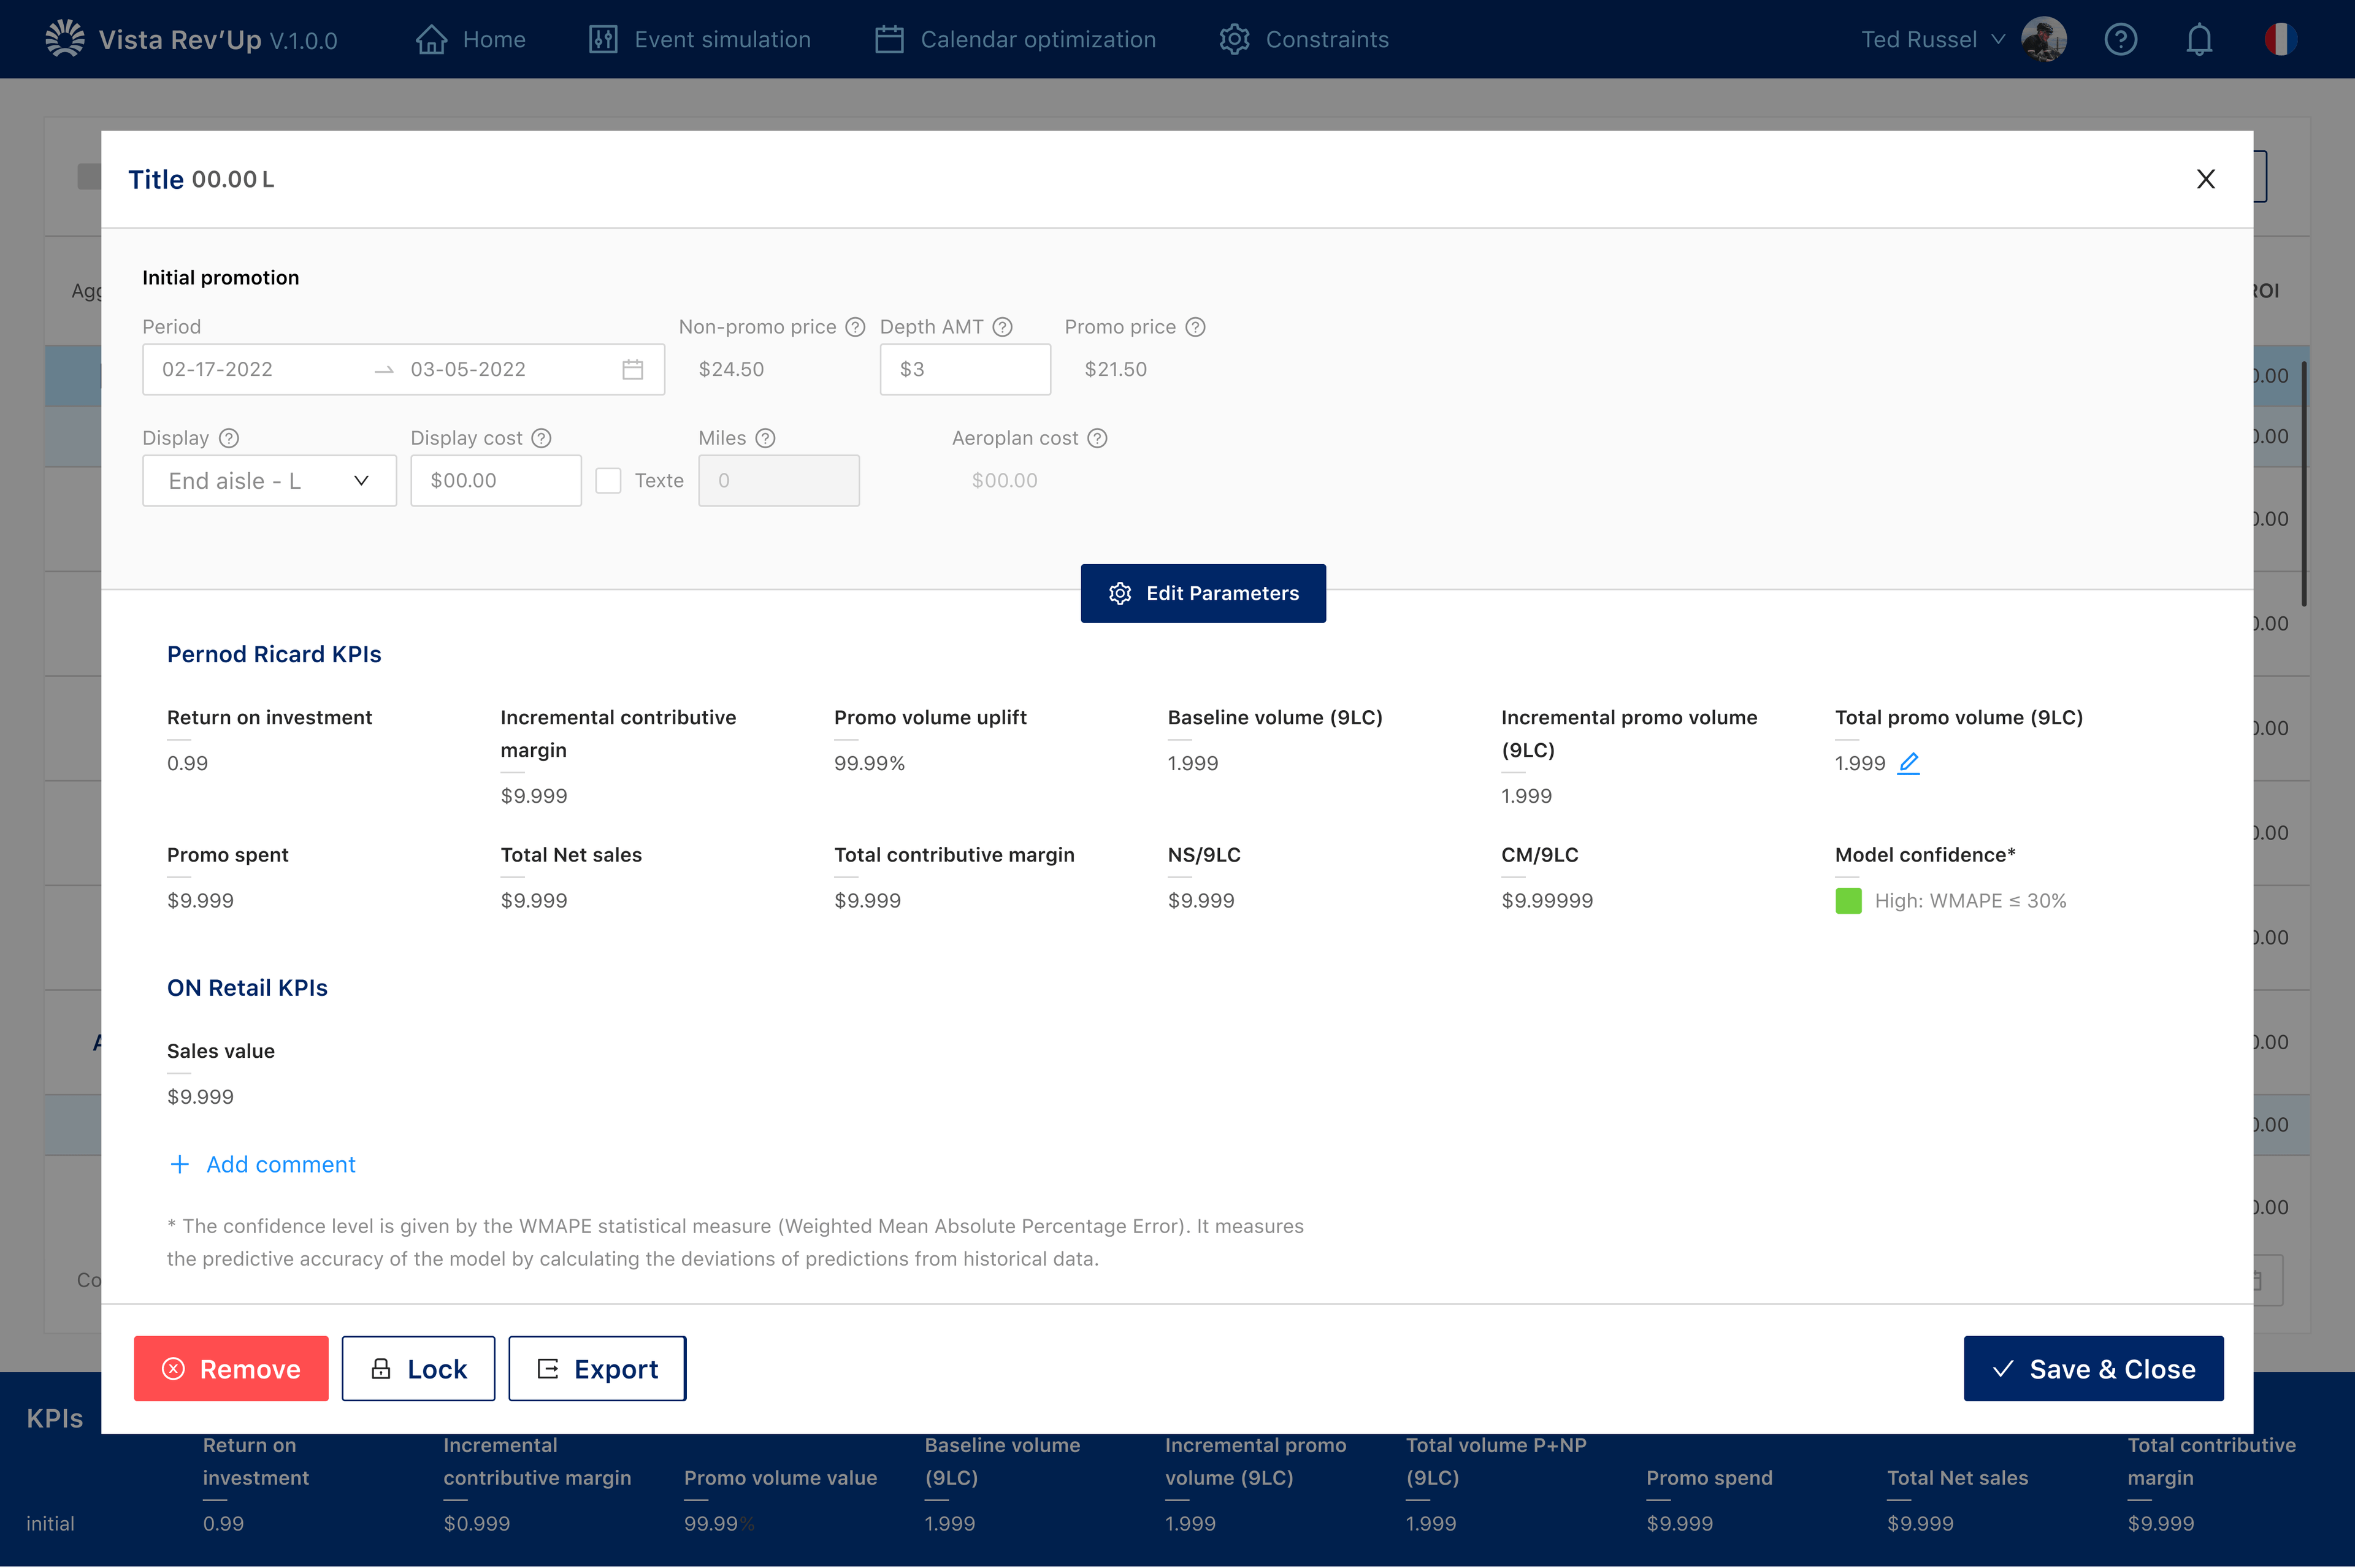
The challenge wasn't showing more data. It was helping people know what to do with it.
Pricing and promotion planning involves several connected pieces of information at once: what is already planned, what is changing, and what that change might do to performance.
Individually, each field or metric can make sense. Together they compete for attention. Users needed a way to keep the current situation in view without having to reconstruct the decision from a dense screen.
The interface was telling us where people were struggling.
Research showed the product was asking people to work harder than the task required. These are findings from that work, not achieved business results.
35%
20%
2.5/5
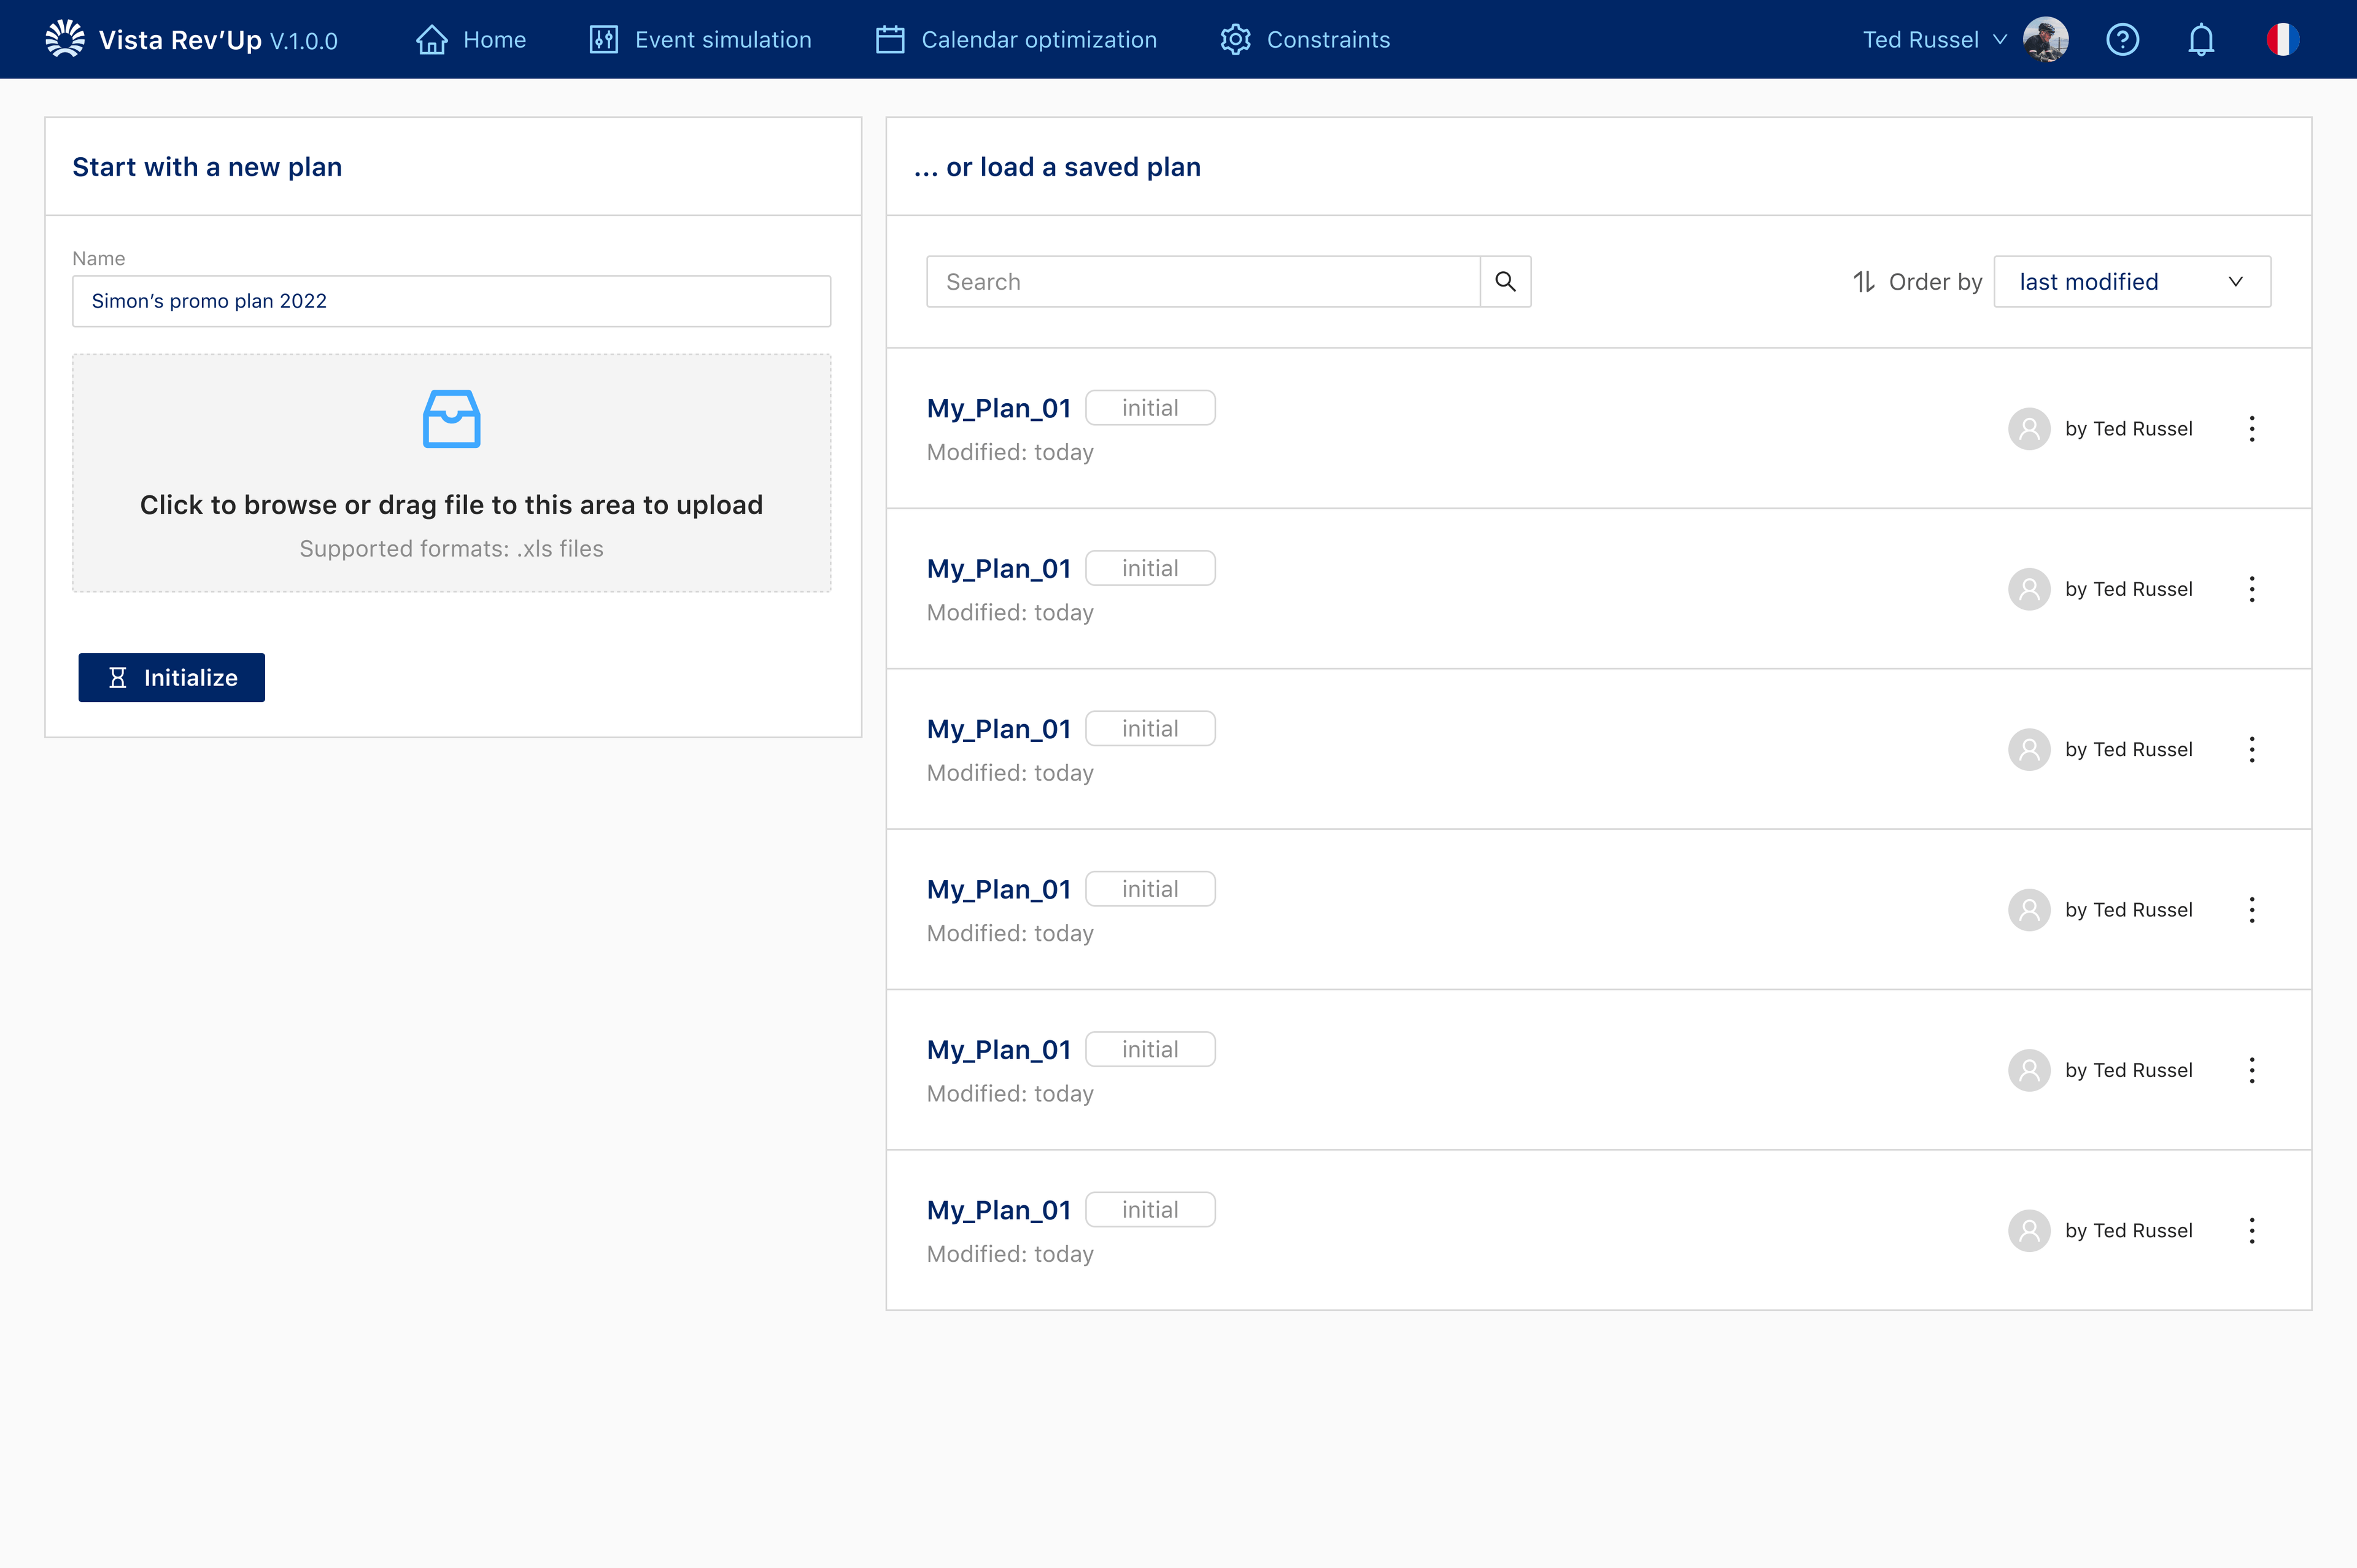
Knowing something was wrong was not the same as knowing what to do.
People were making first-attempt mistakes on budgeting and file upload, and some sessions ended before the work was finished. The input panel itself scored poorly.
The design question was therefore not whether the product had enough information. It was whether the interface made the next decision available at the moment it was needed.
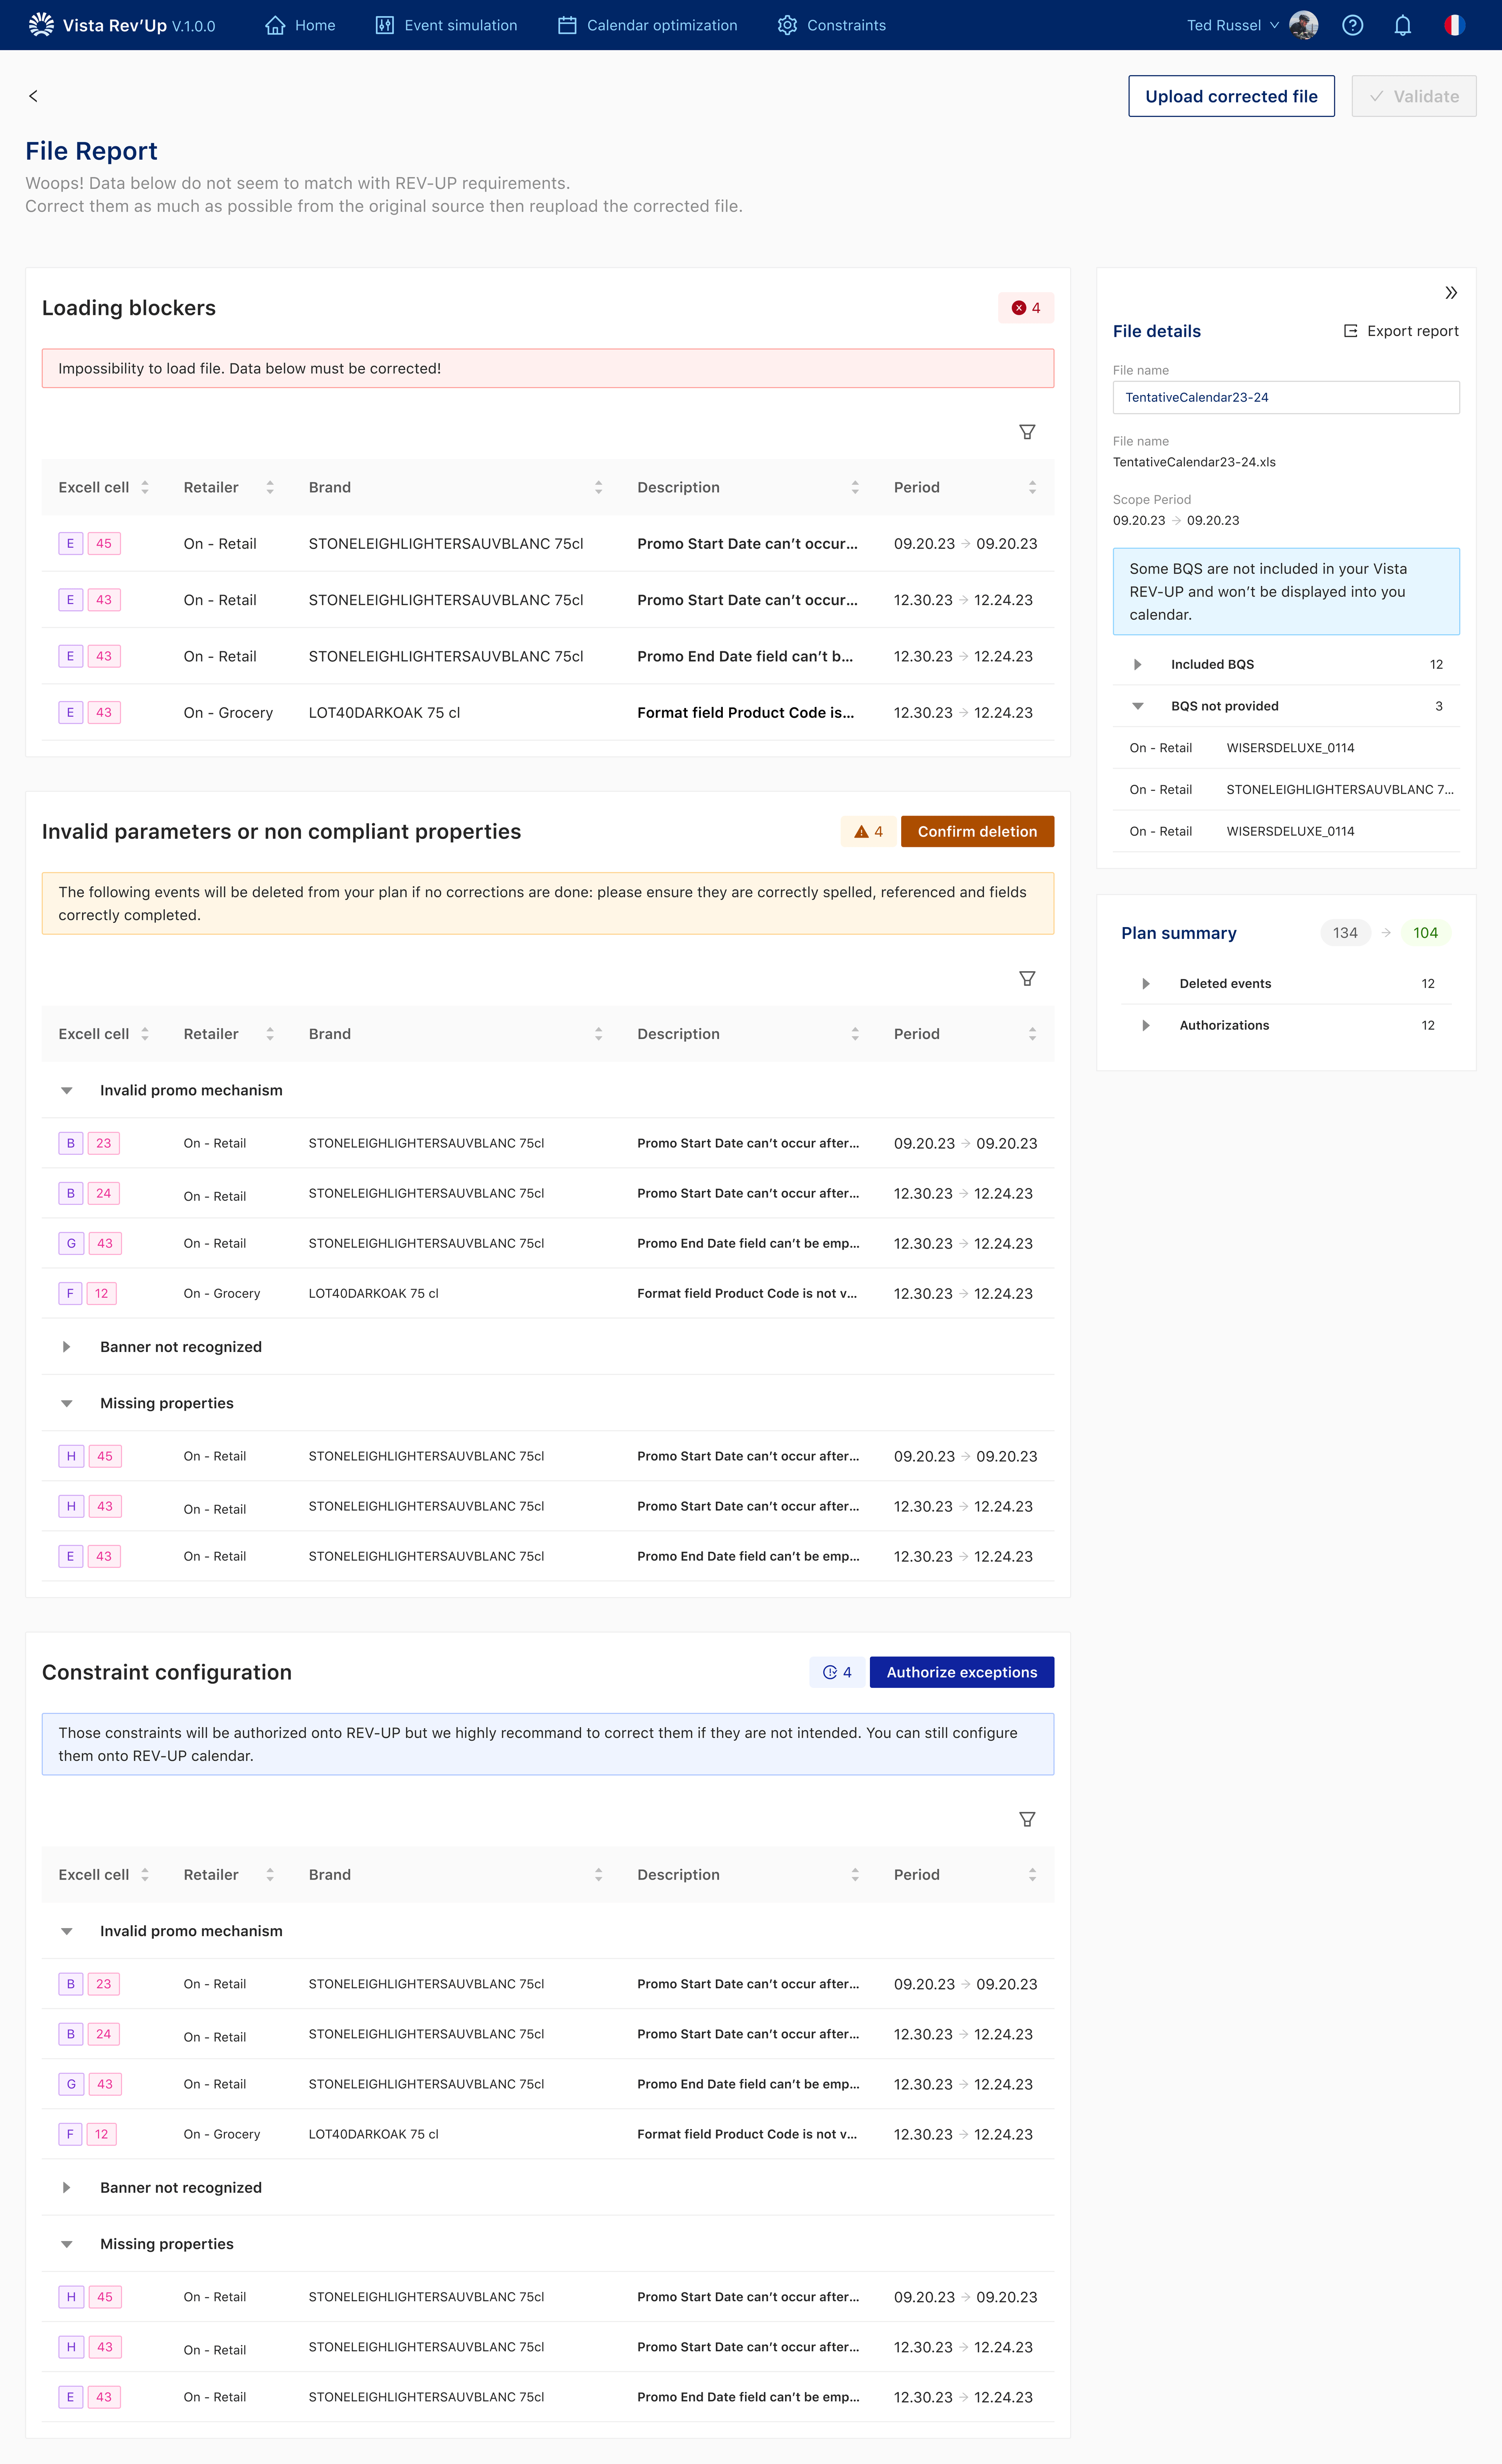
Make the problem visible at the moment a decision is made.
Actions needed to sit with the information they affected. Hierarchy needed to show what required attention now, and what could wait.
The aim was to support expert judgment, not to hide the commercial complexity behind a simpler-looking screen.
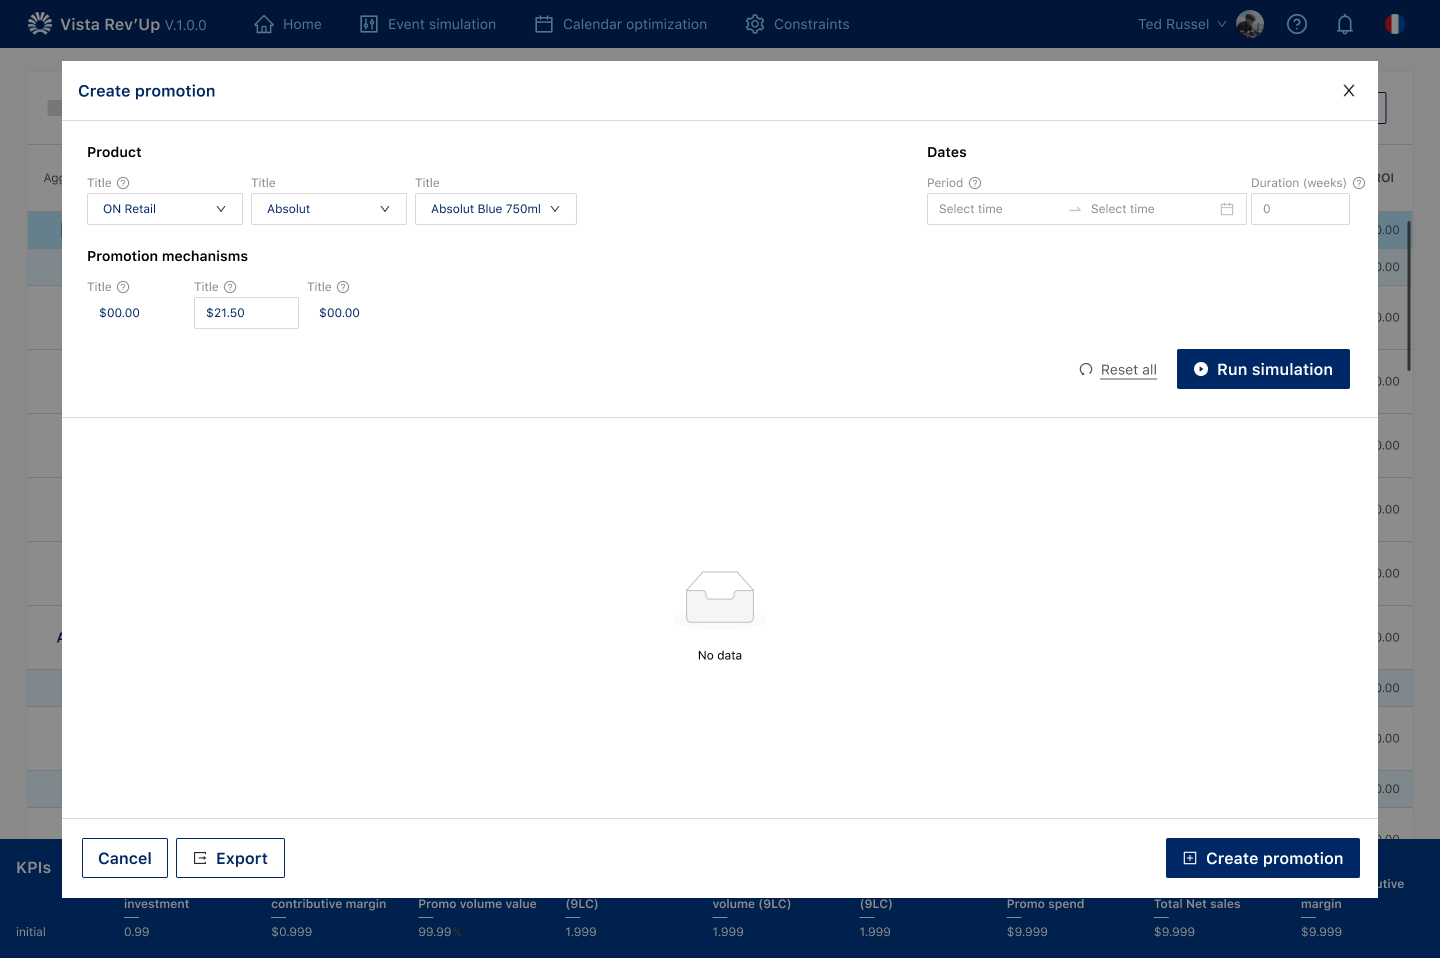
Different levels of information needed different levels of attention.
Calendars, events and performance metrics do not all deserve the same visual weight. Some numbers need to be compared. Some need to be scanned. Some only matter after a decision has already started.
I worked on grouping related information, making comparison possible, and keeping supporting detail available without competing with the current task.
The first answer wasn't automatically the right one.
Some versions showed more immediately. Others pushed more behind interaction. The useful work was finding the balance between visibility and focus.
3+ rounds of usability testing were used as process evidence, not as an outcome metric.
A clearer way to work with commercial information.
The product kept its depth. What changed was the order in which that depth appeared: context first, then the decision, then the detail needed to act.
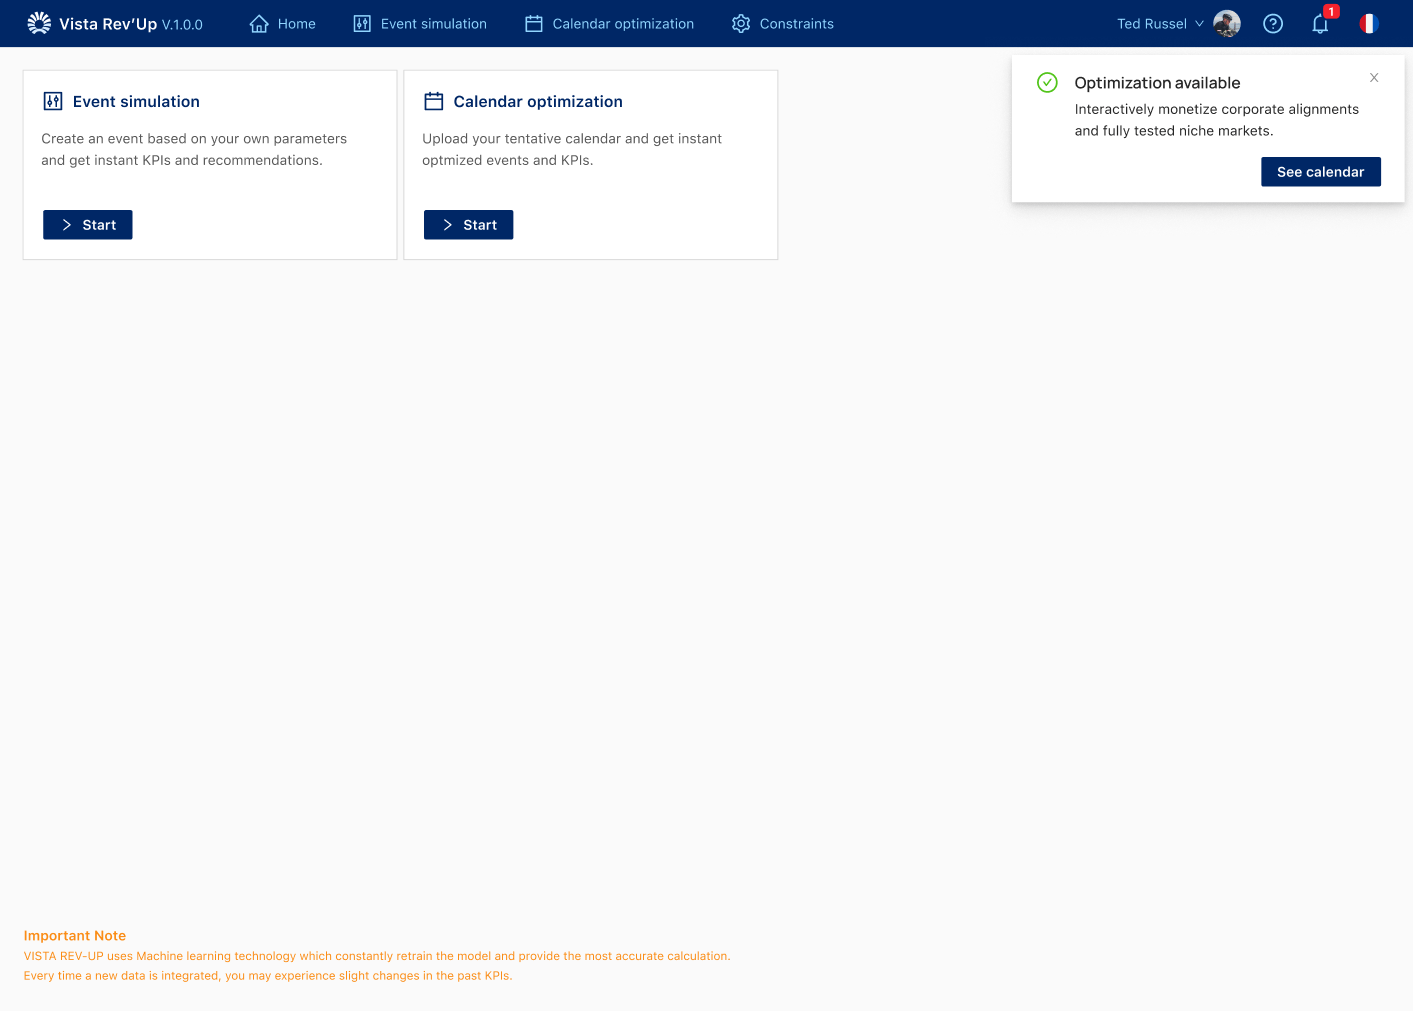
The tool should support expert judgment, not replace it.
Commercial teams already understand the domain. The designer's job is to make the next decision easier to see, not to flatten the work into something that looks simpler than it is.