(08)Desktop
Matrix
Matrix is a Pernod Ricard tool for testing and comparing marketing investment scenarios. Its users already understand the domain; the interface had to help them compare and decide.
- Company
- Pernod Ricard
- Role
- Product Designer
- Year
- 2021–2023
- Type
- AI & Data · Internal Product
01Overview
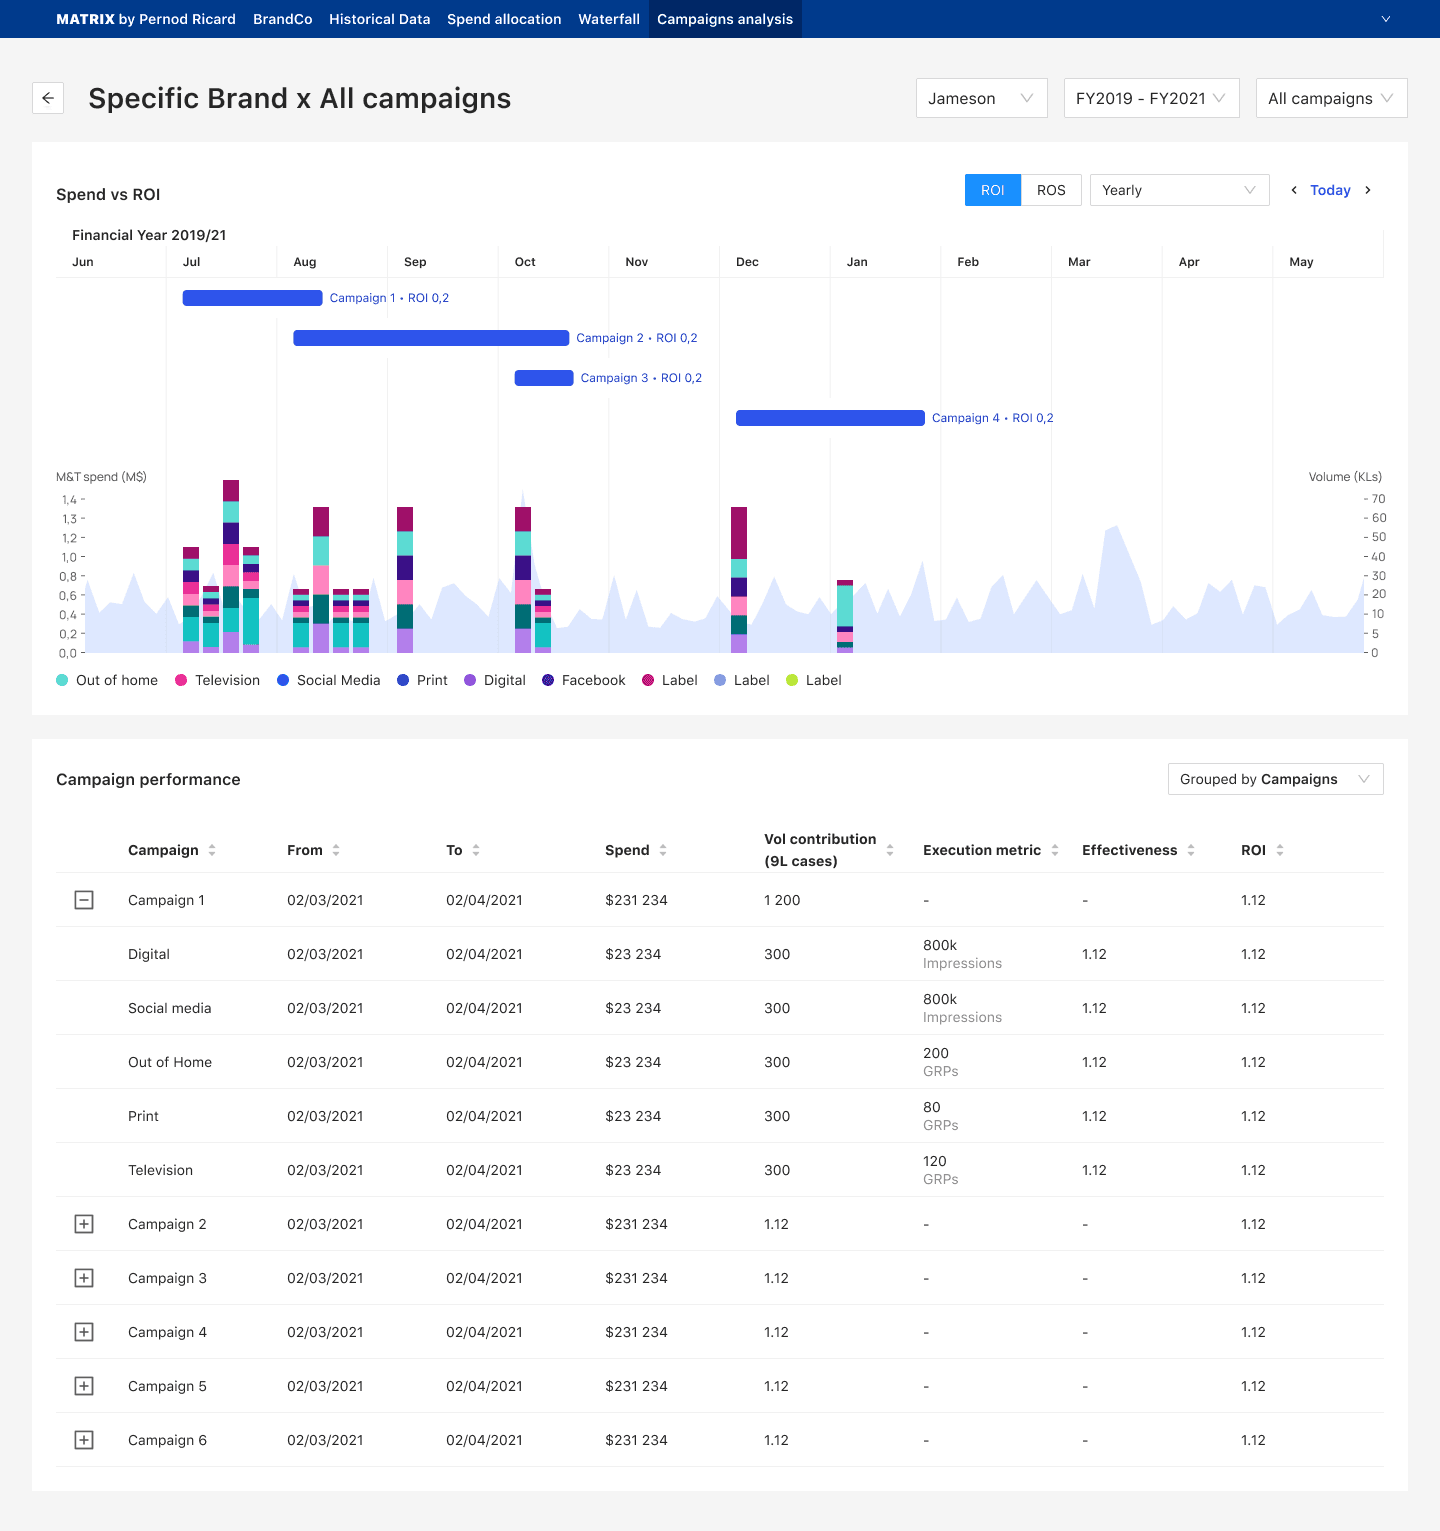
Matrix brings together campaign timelines, spend by channel, ROI and scenario planning for marketing teams. It is information-dense by necessity.
02My role
Product Designer
- Views of spend vs ROI at different time scales
- Campaign performance tables and grouping
- The control tower for managing scenarios
- Hierarchy for expert users
03The challenge
You don’t always need less information; you need a better way to see it. Removing data wasn’t an option, so hierarchy, grouping and comparison had to do the work that empty space couldn’t.
- 01Several options side by side
- 02Columns competing for the same weight
- 03Scenarios that must be set up, compared and finalised
04Approach
4.1
See the spend, then decide which scenario stands
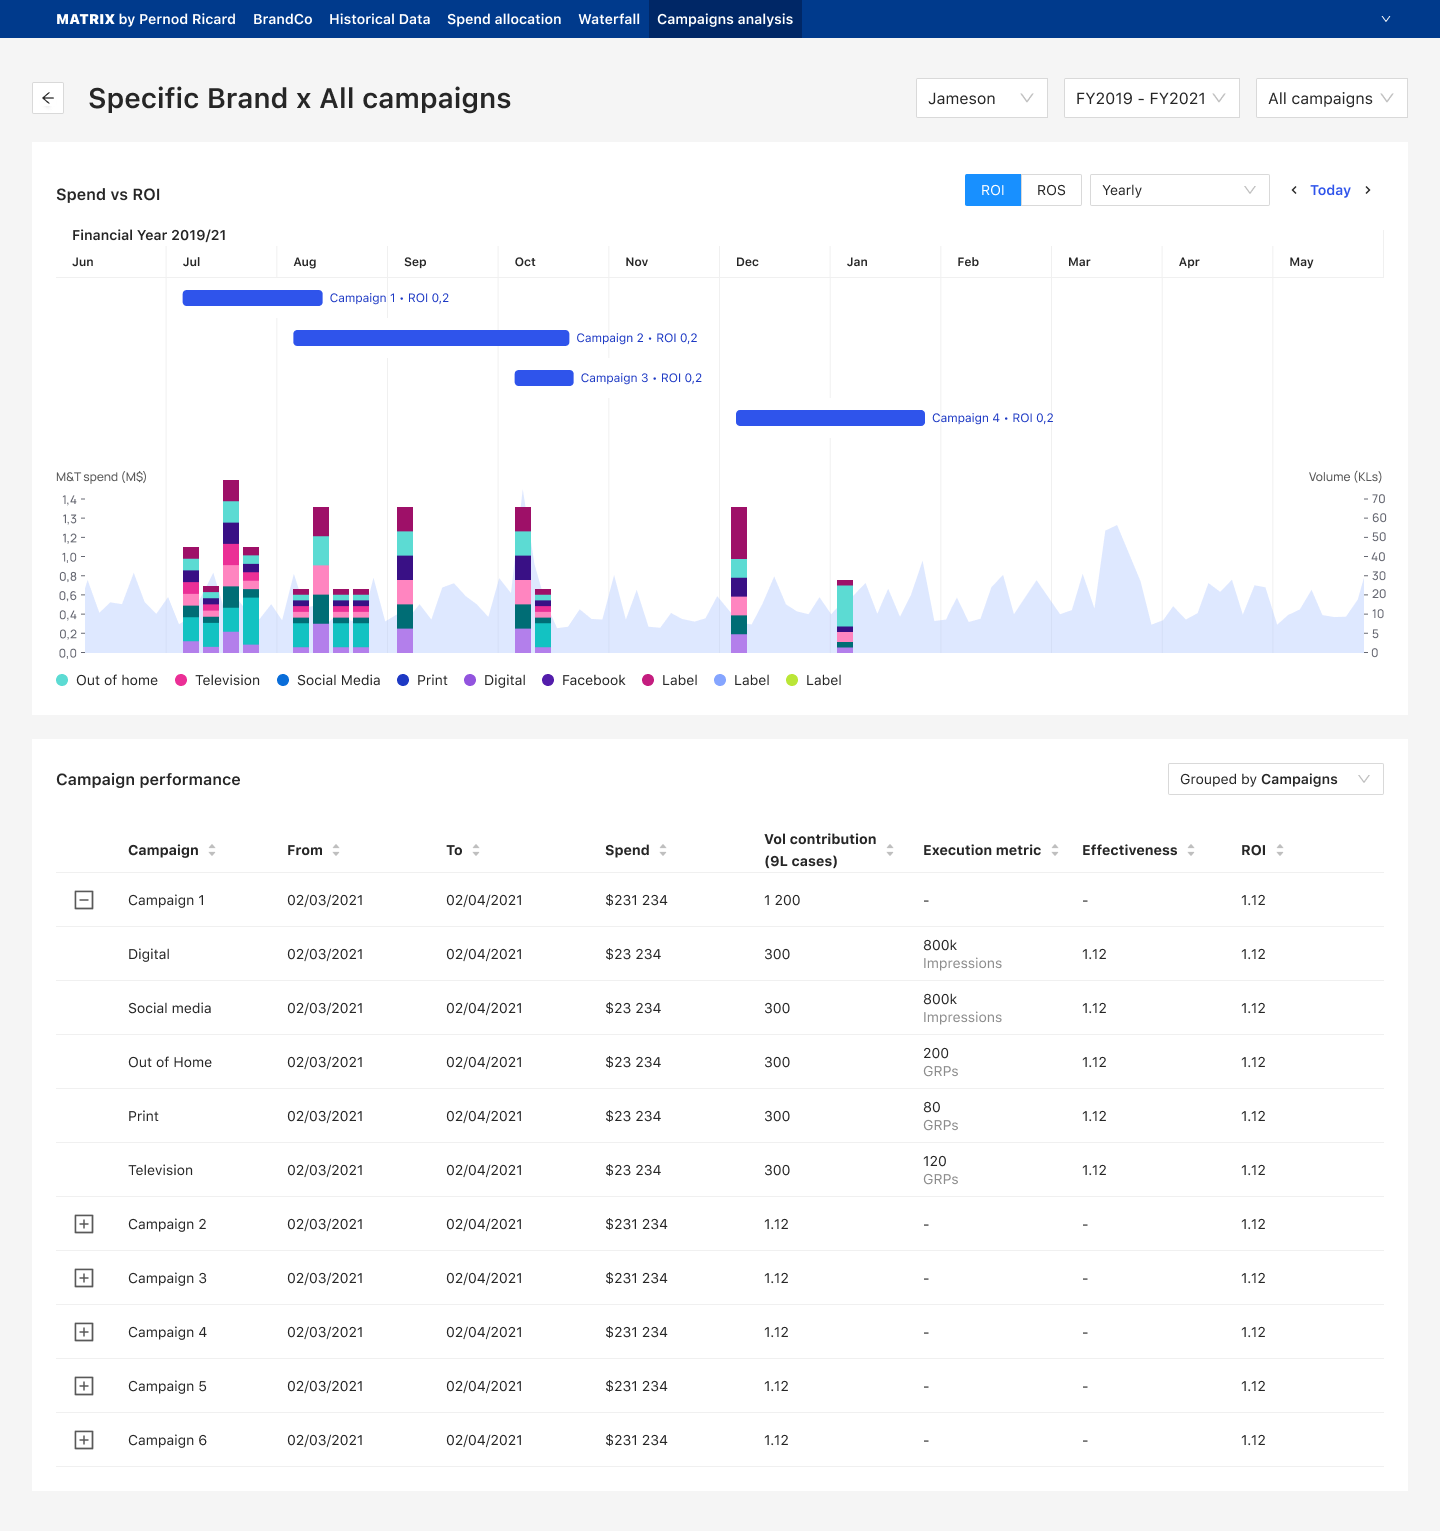
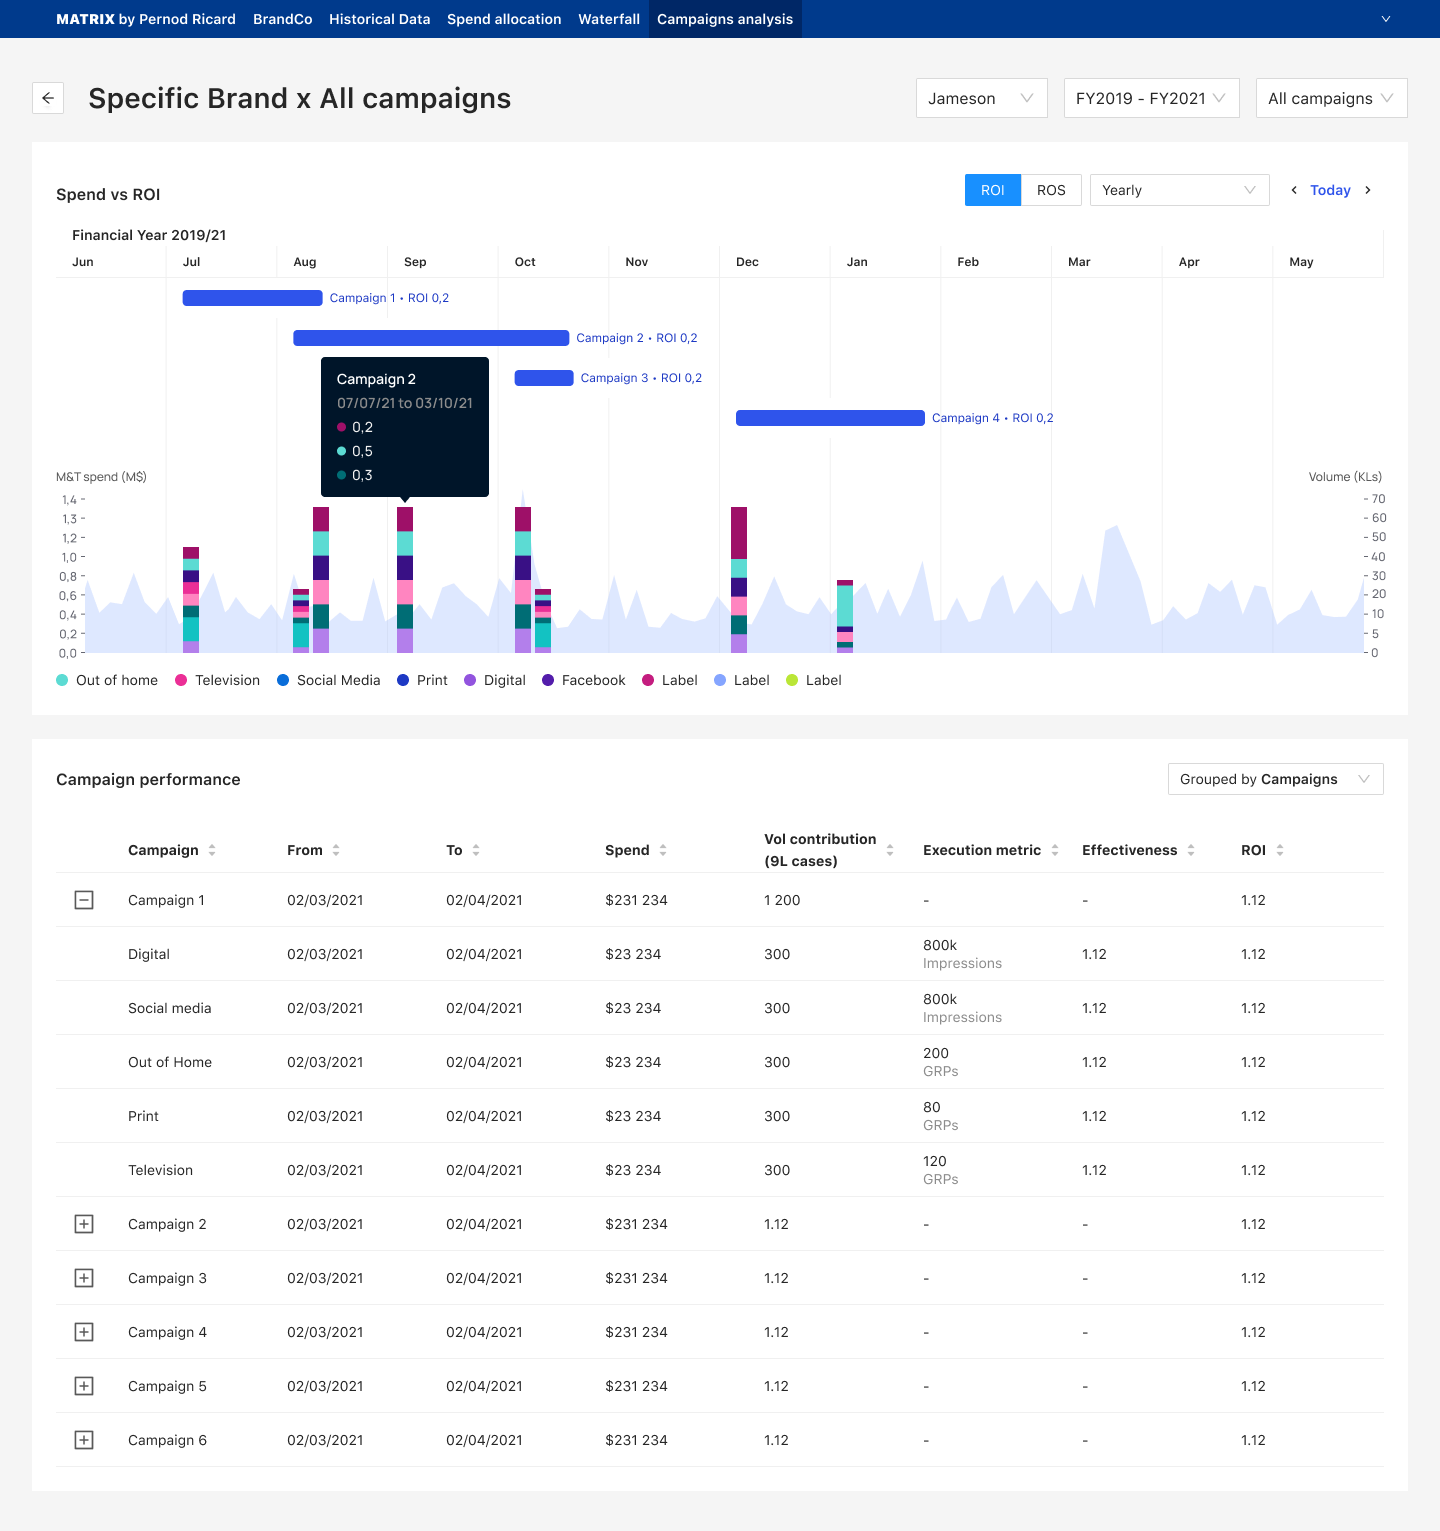
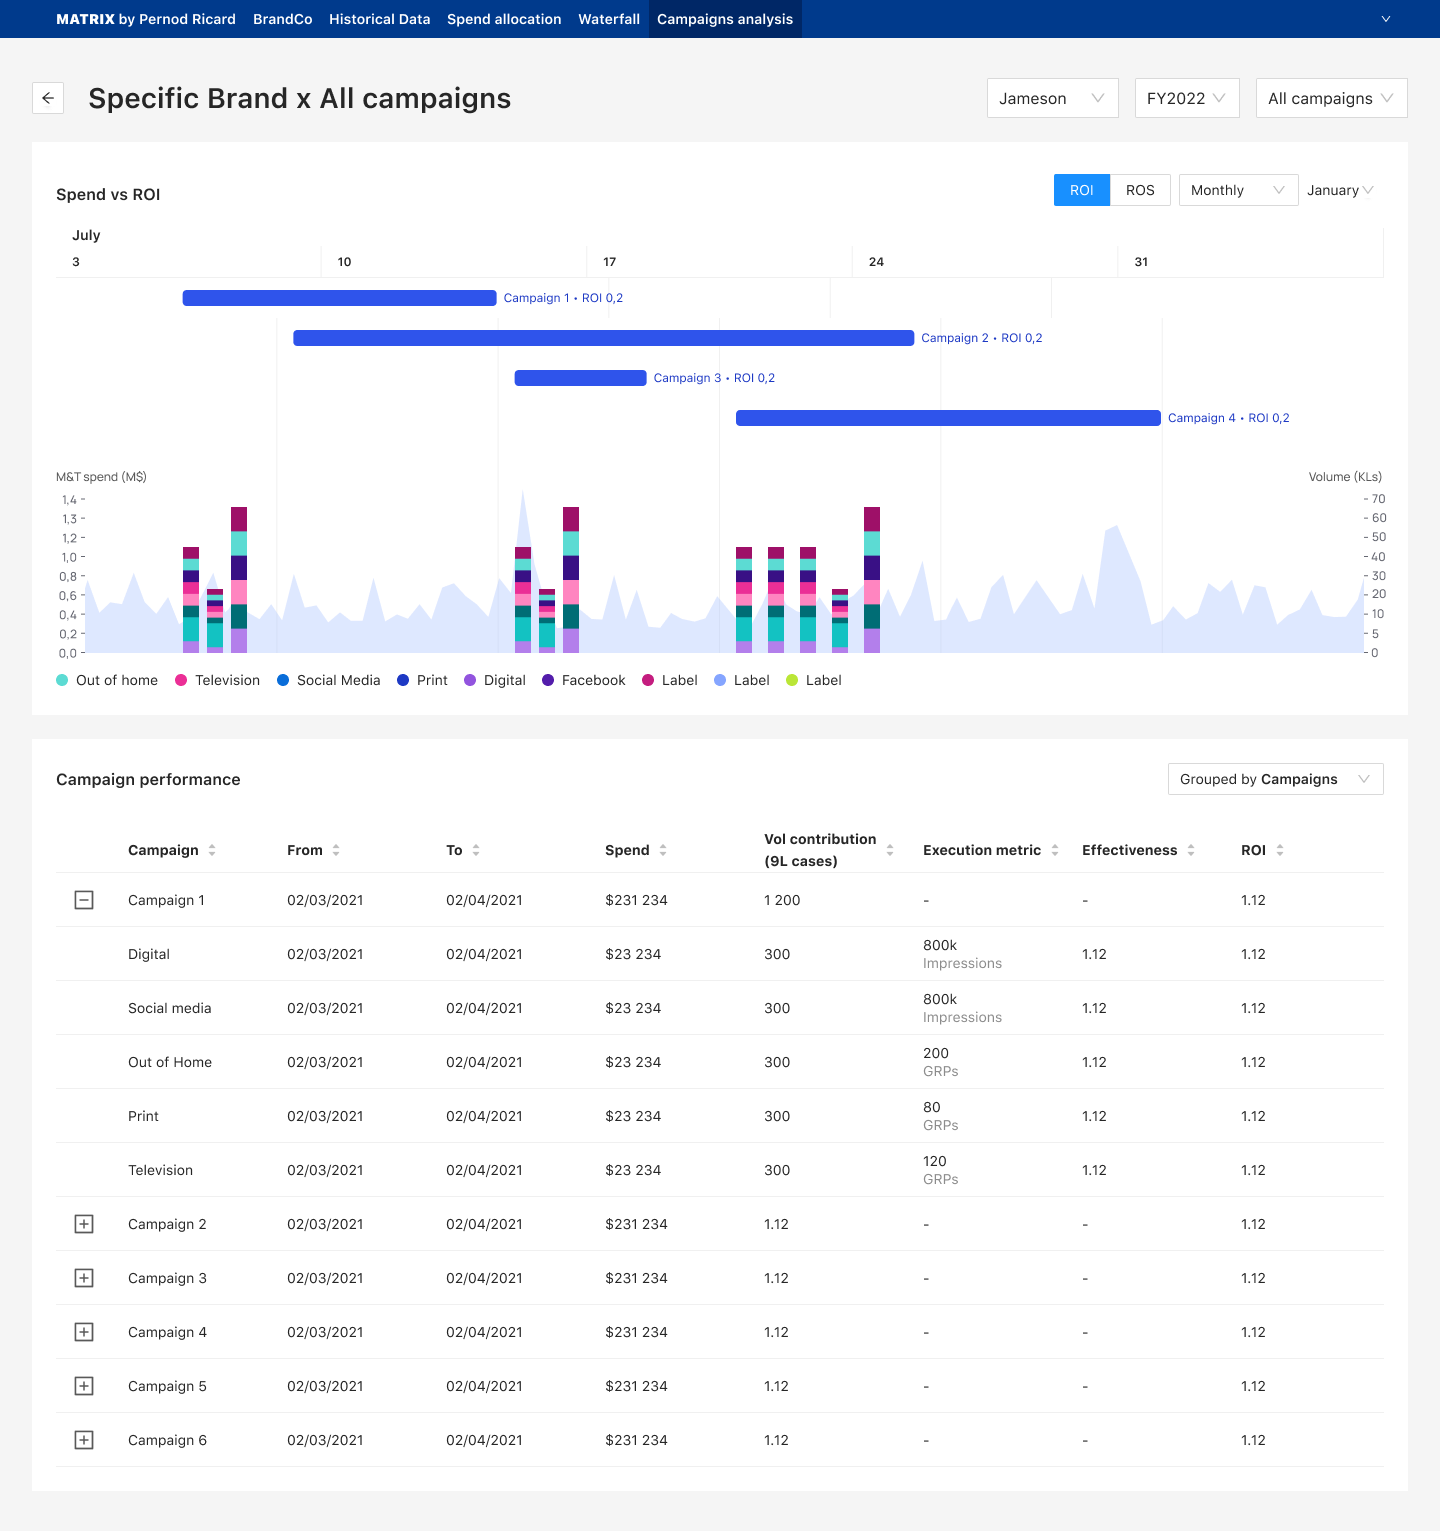
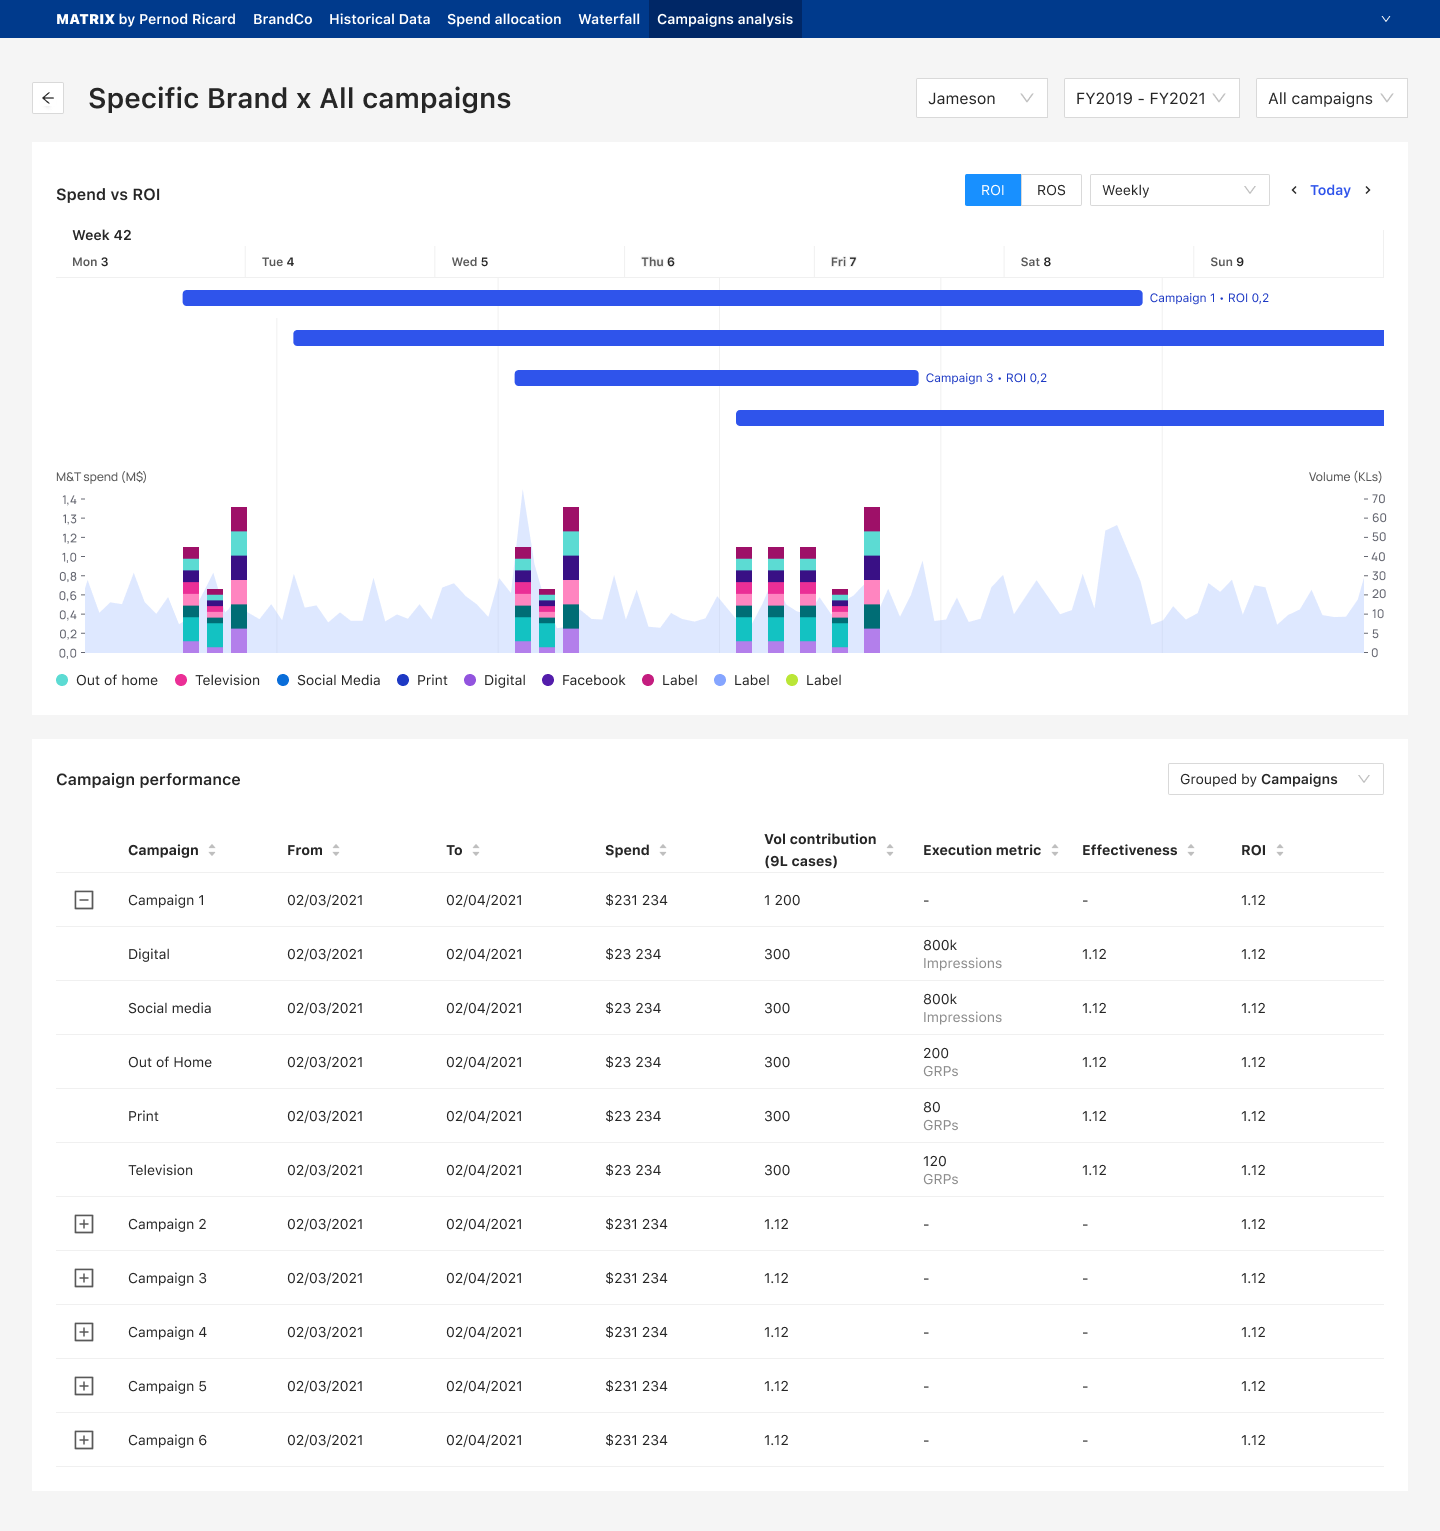
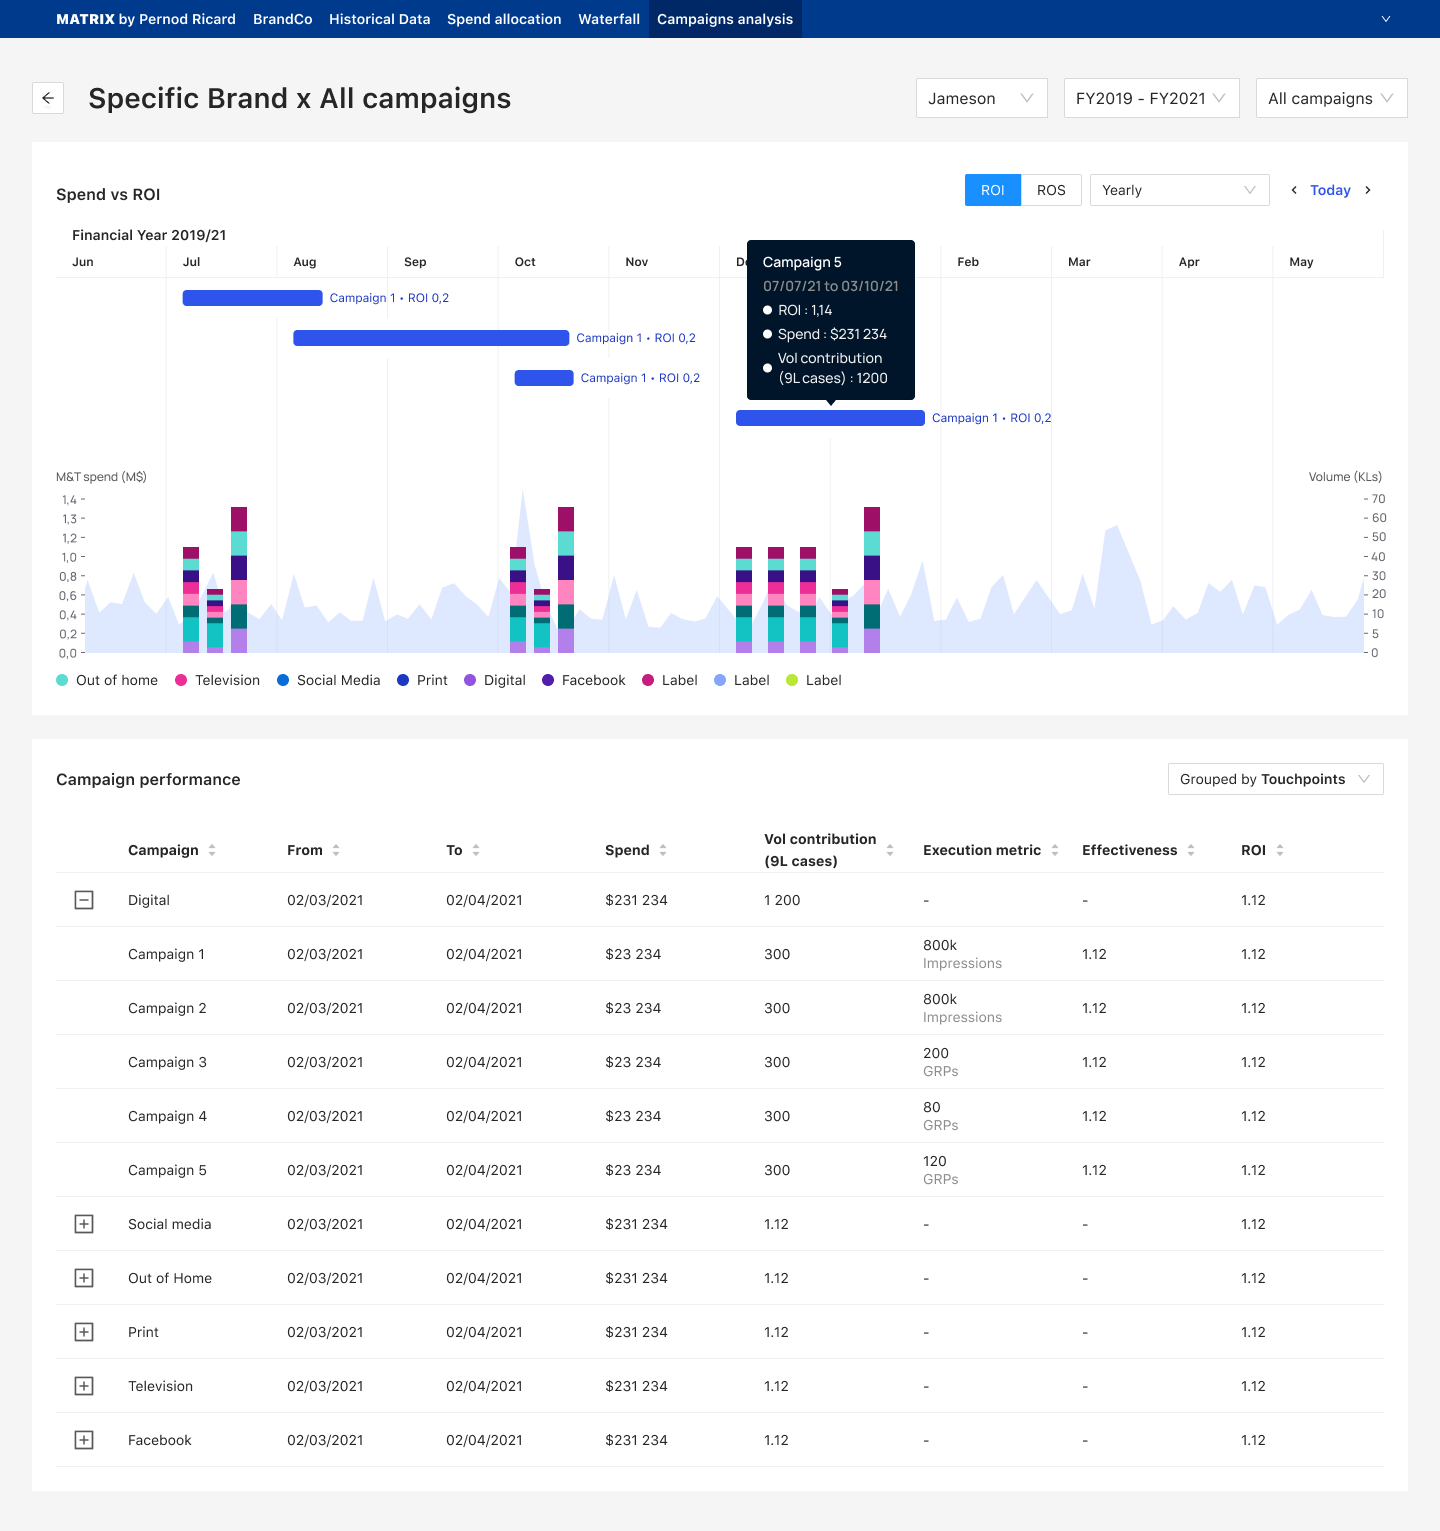
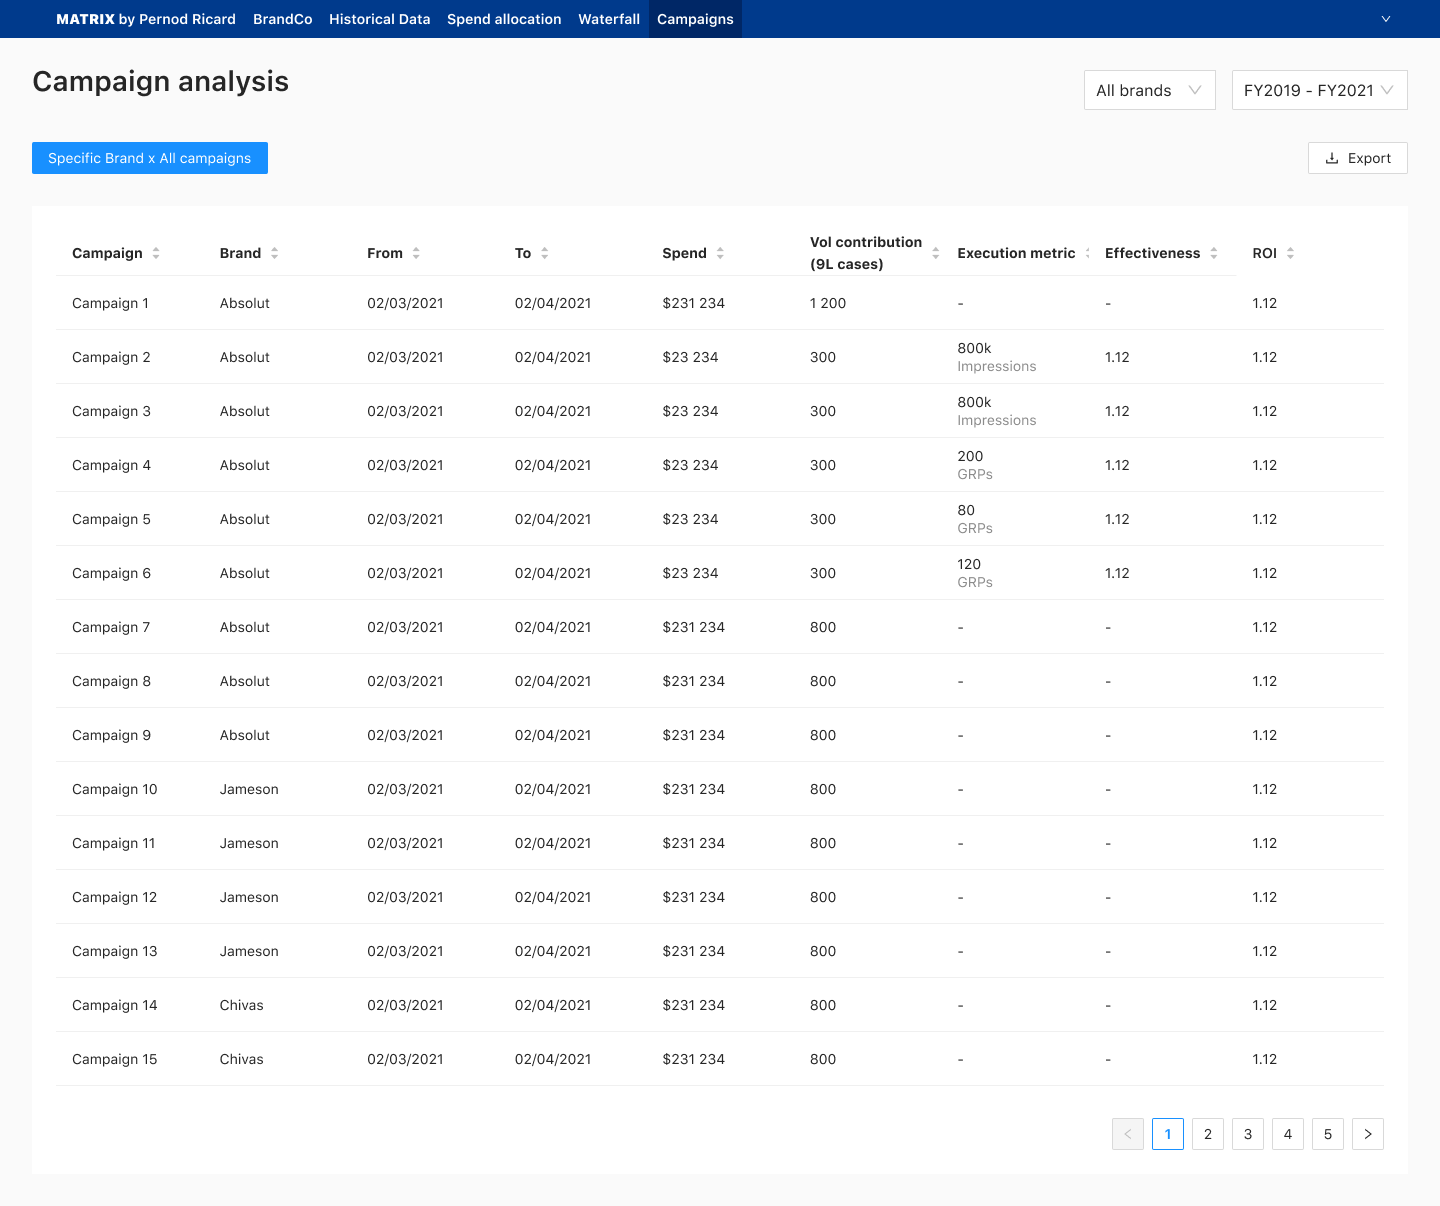
Matrix is for marketing teams who already know the numbers. One view shows spend against ROI by year, month or week, with a campaign’s dates and channels in a tooltip. The same campaigns can be grouped by campaign or by touchpoint, or listed across every brand.
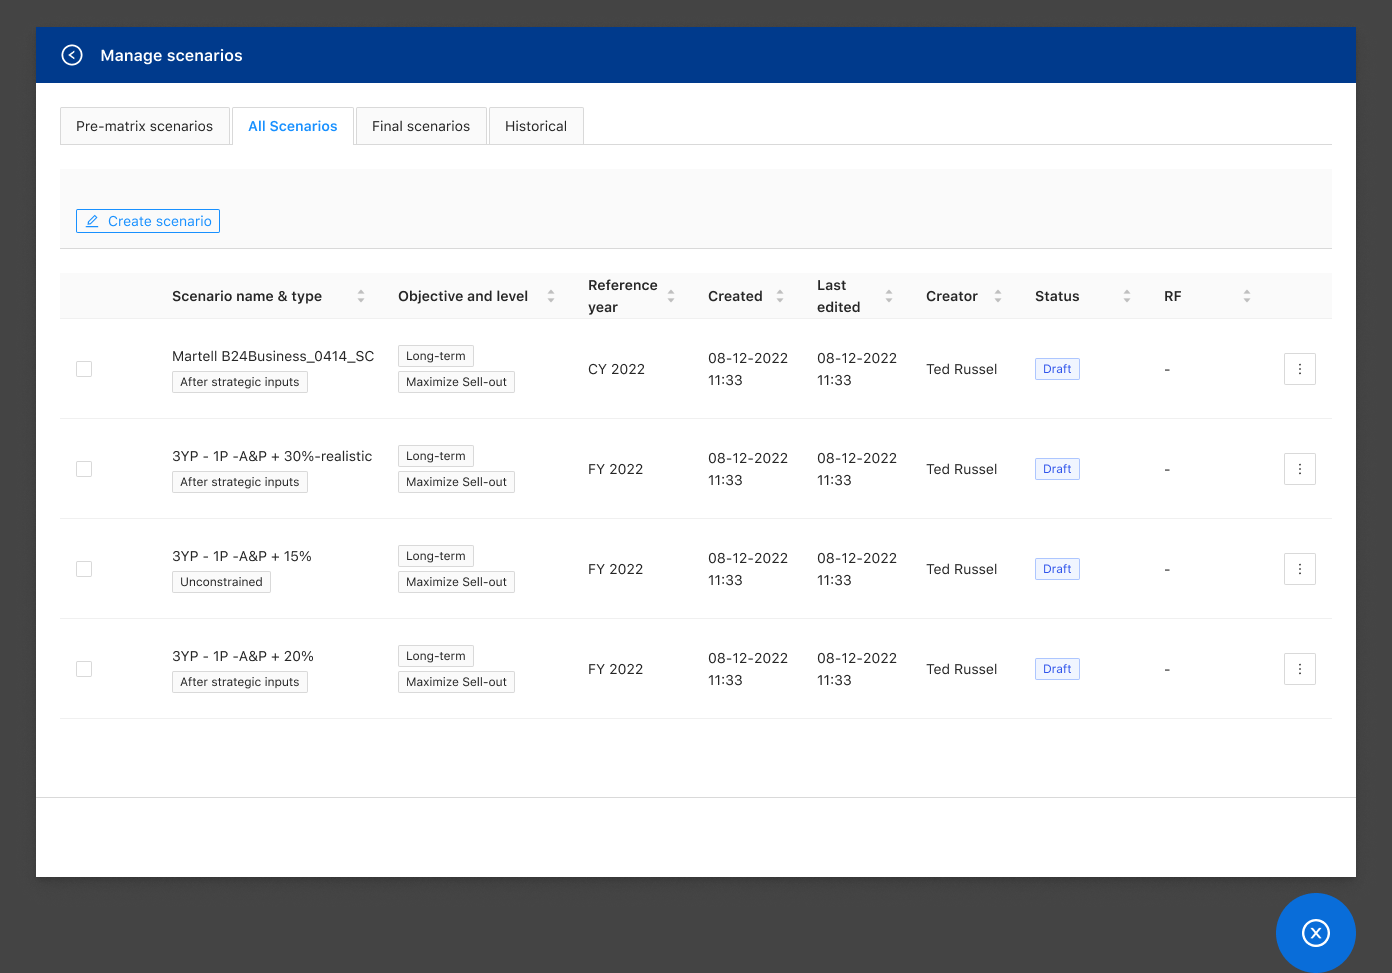
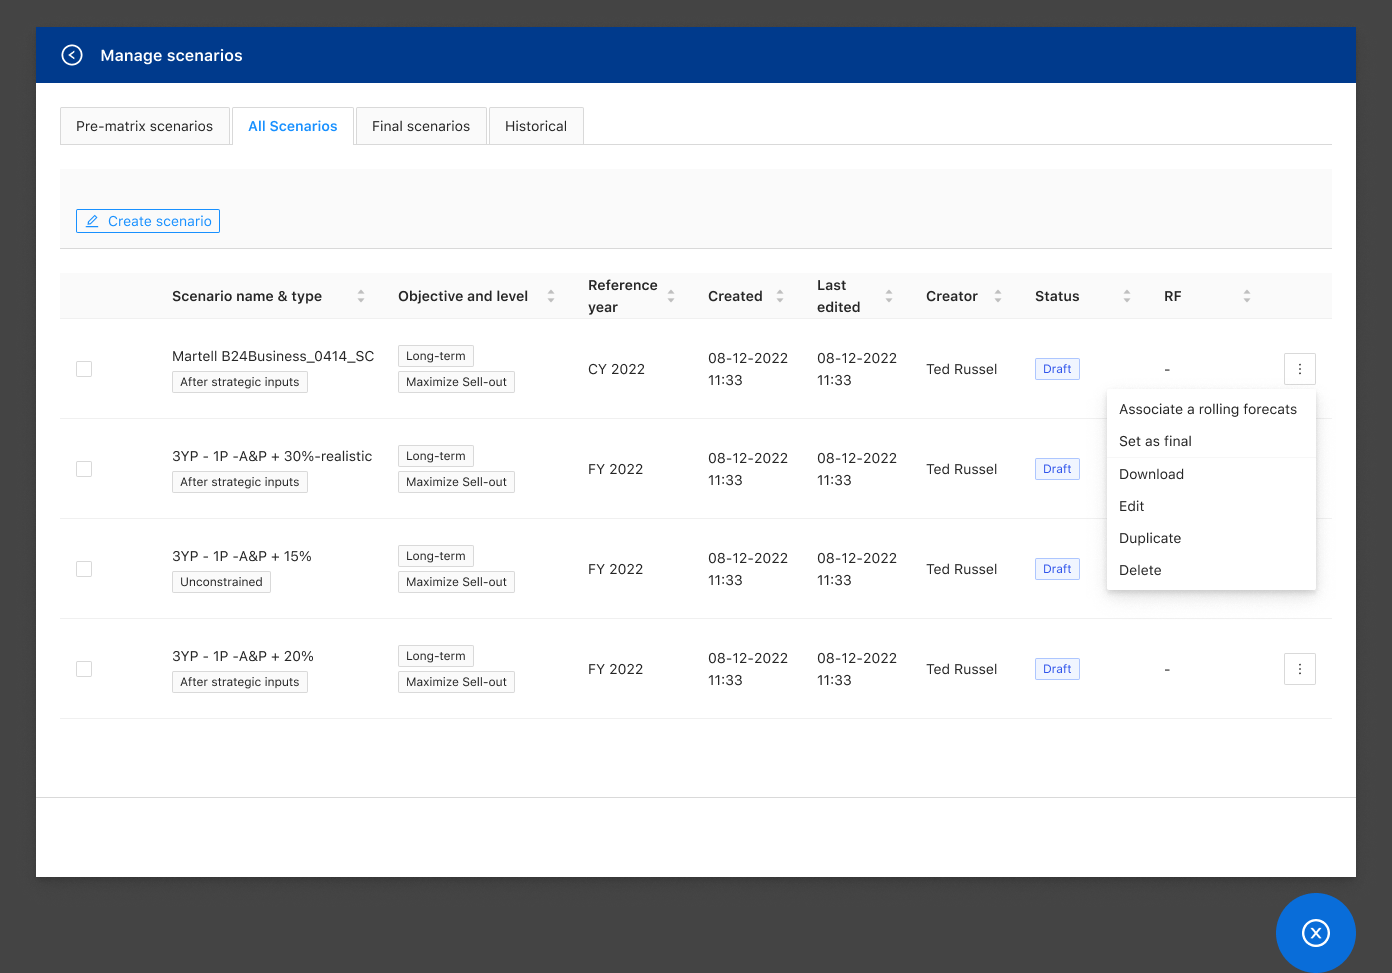
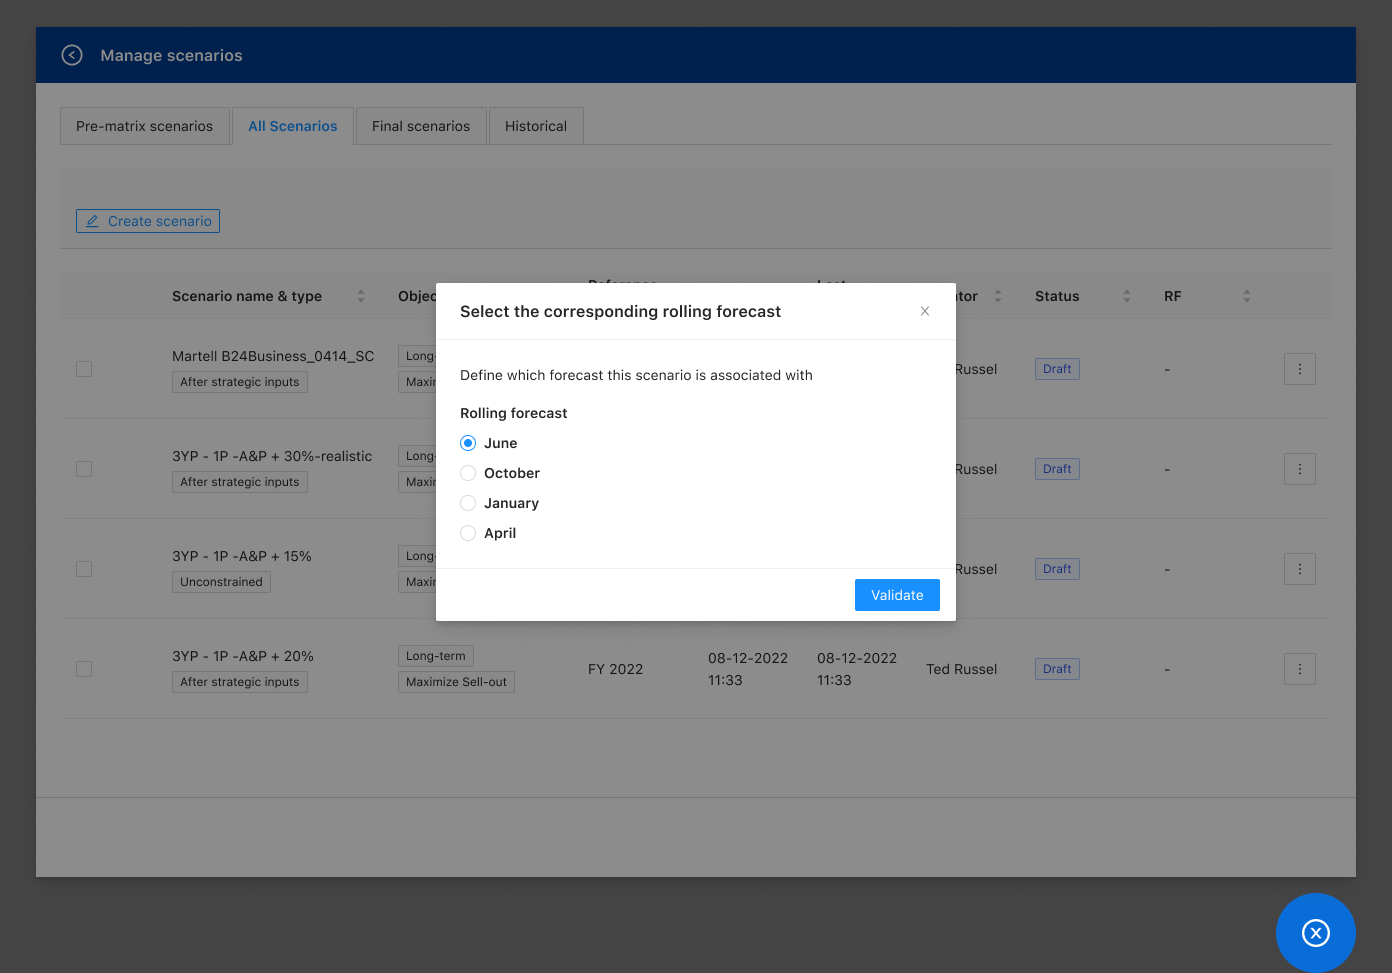
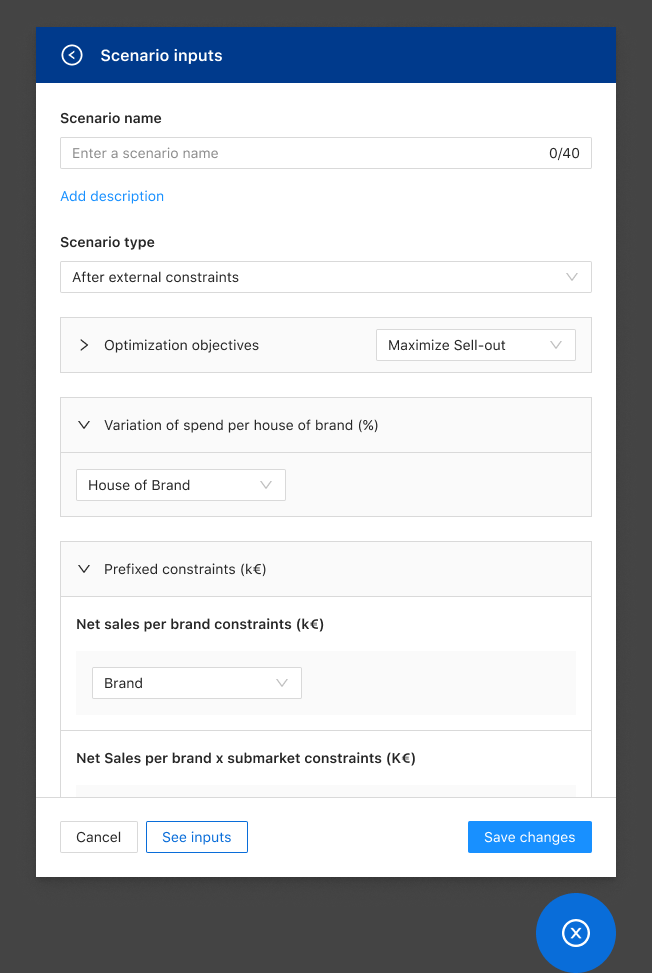
The control tower is where scenarios are managed: type, objective, reference year and status. A scenario can be tied to a rolling forecast, set as final, duplicated or edited. Its inputs open beside the list. Help, guides and what’s new sit in one menu.
05Key flows
5.1
Spend vs ROI over time
The same view works by year, month and week, with campaign details in a tooltip.
- 1Yearly
- 2Campaign tooltip
- 3Monthly
- 4Weekly
5.2
Comparing campaigns
Performance can be grouped by campaign or by touchpoint, and analysed across all brands.
 Open full size
 Open full size
5.3
Managing scenarios
In the control tower, scenarios are listed with type, objective, reference year and status. From one row a scenario can be linked to a rolling forecast, set as final, duplicated or edited, and its inputs open in a side panel.
- 1Manage scenarios
- 2Row actions
- 3Choose a rolling forecast
- 4Edit inputs
 Open full size
 Open full size
 Open full size
 Open full size
06Design decisions
Start from the decision
What is being decided, what supports it, what is visible first and what can wait.
Design for comparison
Alignment, status and grouping let the eye move across a scenario rather than rebuild it.
Help one click away
FAQ, guides, what’s new and requests sit in a help menu.
07Outcome
Designing for specialists doesn’t mean making the interface complicated. It means knowing what they need immediately, and what they can open when they’re ready.