Helping marketing teams compare investment decisions with more confidence.
An internal marketing performance tool used to test and compare investment scenarios.
- Pernod Ricard
- Product Designer
- 2021–2023
- AI & Data · Internal Product
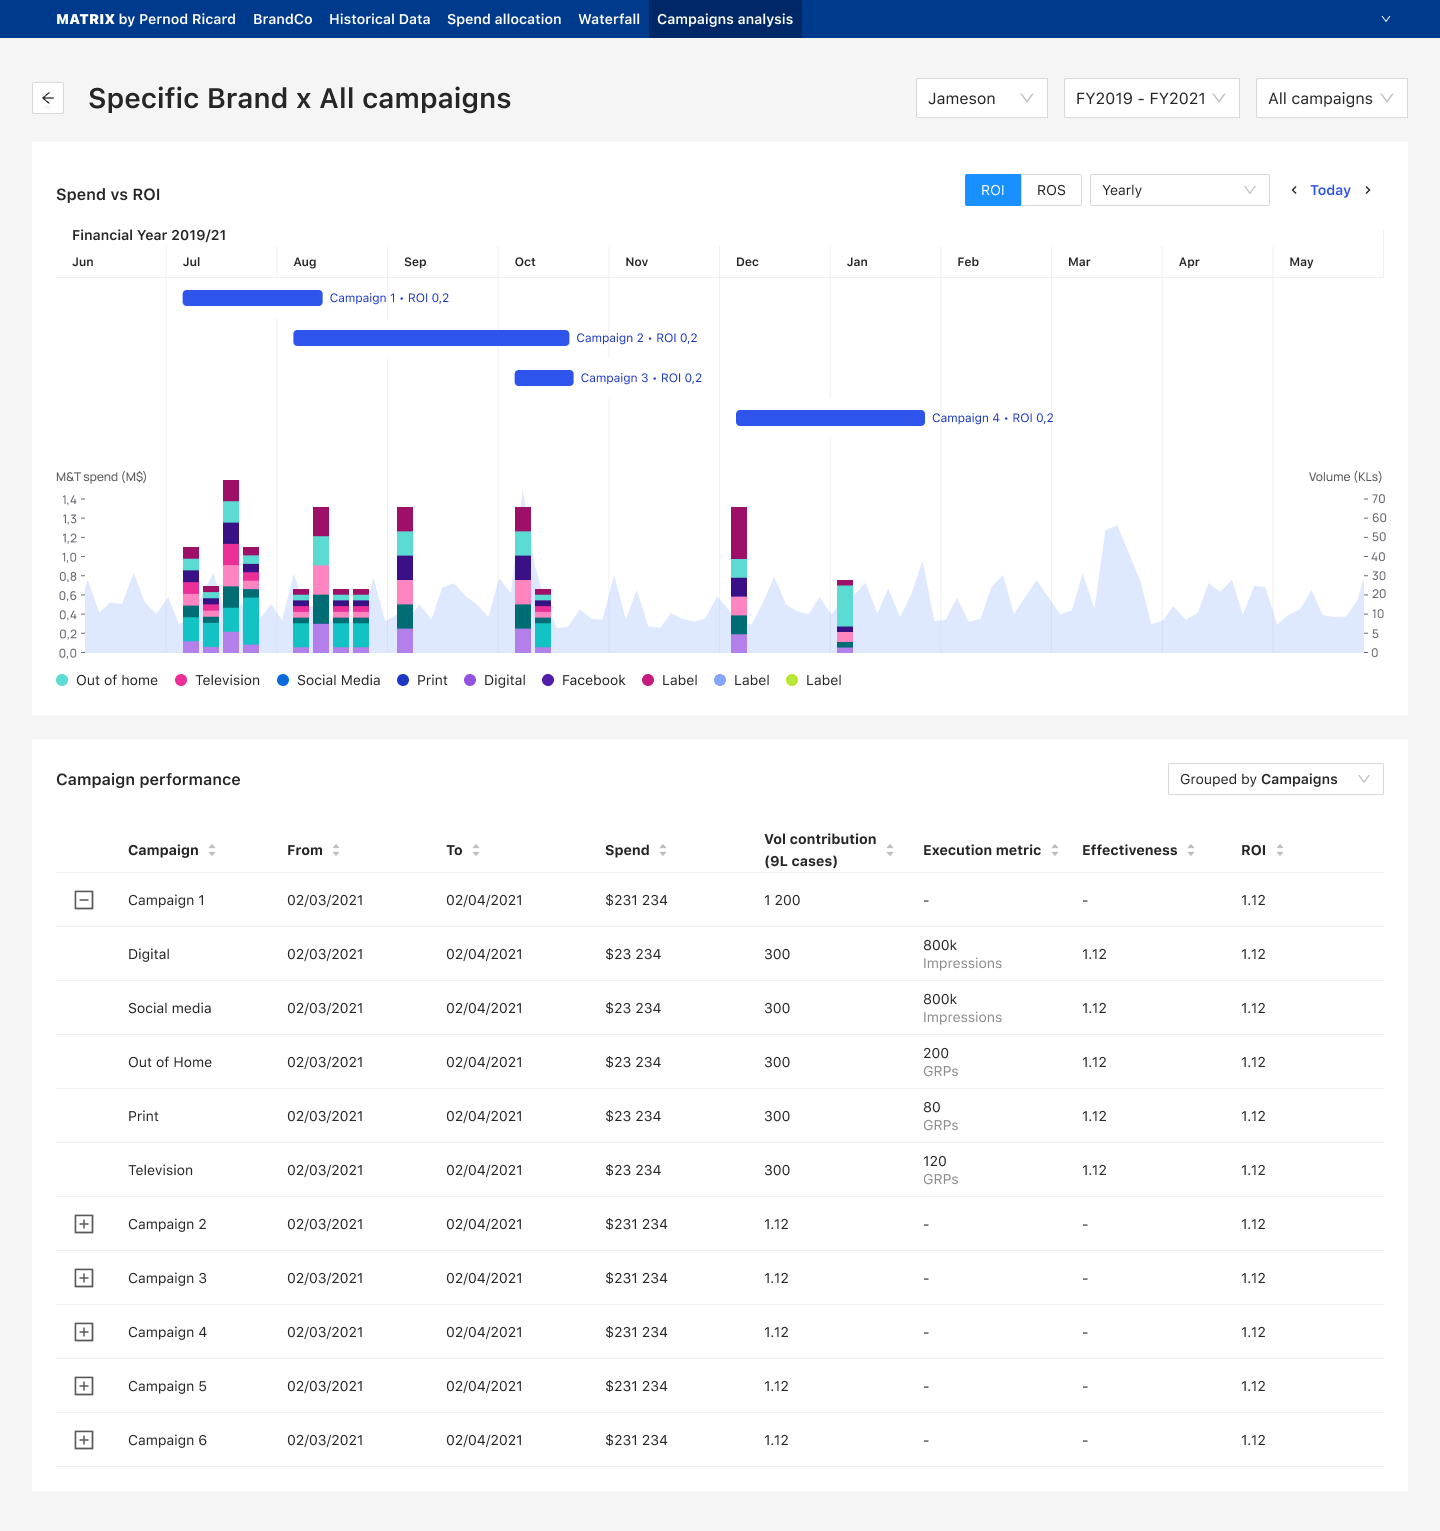
The interface had to support decisions, not just display data.
Matrix is used by people who already understand the domain. The interface did not need to introduce every concept from scratch. It needed to make existing information easier to compare and act on.
You do not always need less information. You need a better way to see it.
The product is information-dense by necessity. Removing data was not always an option. Hierarchy, grouping and comparison had to do the work that empty space could not.
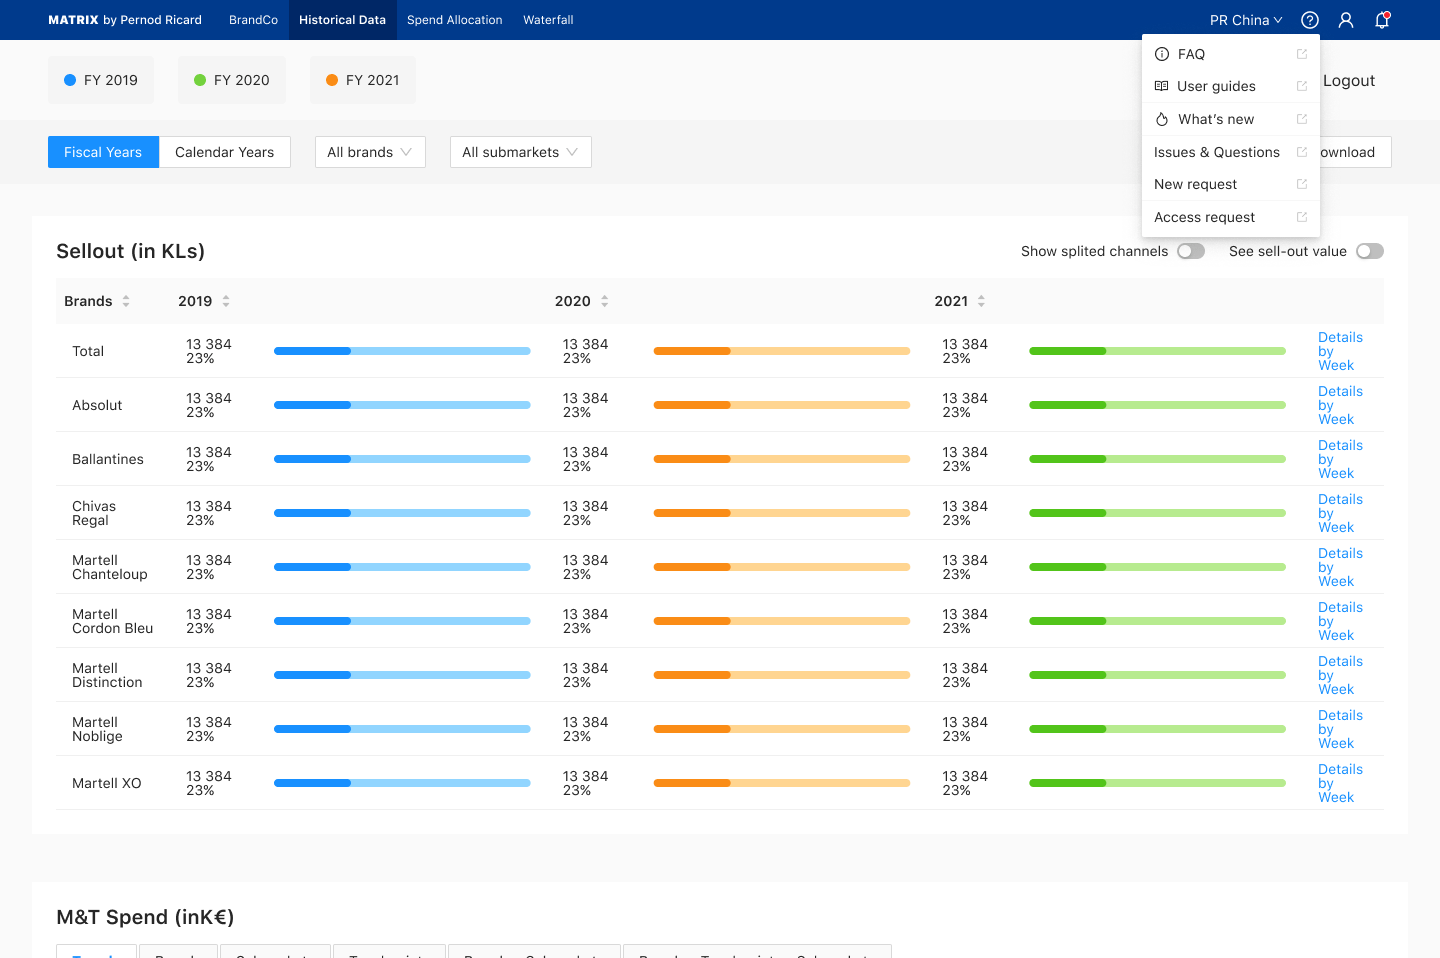
Start from the decision, then work backwards.
What decision is being made? What information supports it? What needs to be visible first, and what can wait until the user is ready to go deeper?
Tables and scenarios had to make comparison possible.
When several options sit side by side, every column cannot have the same visual weight. Alignment, status and grouping were used so the eye could move across a scenario rather than reconstruct it.
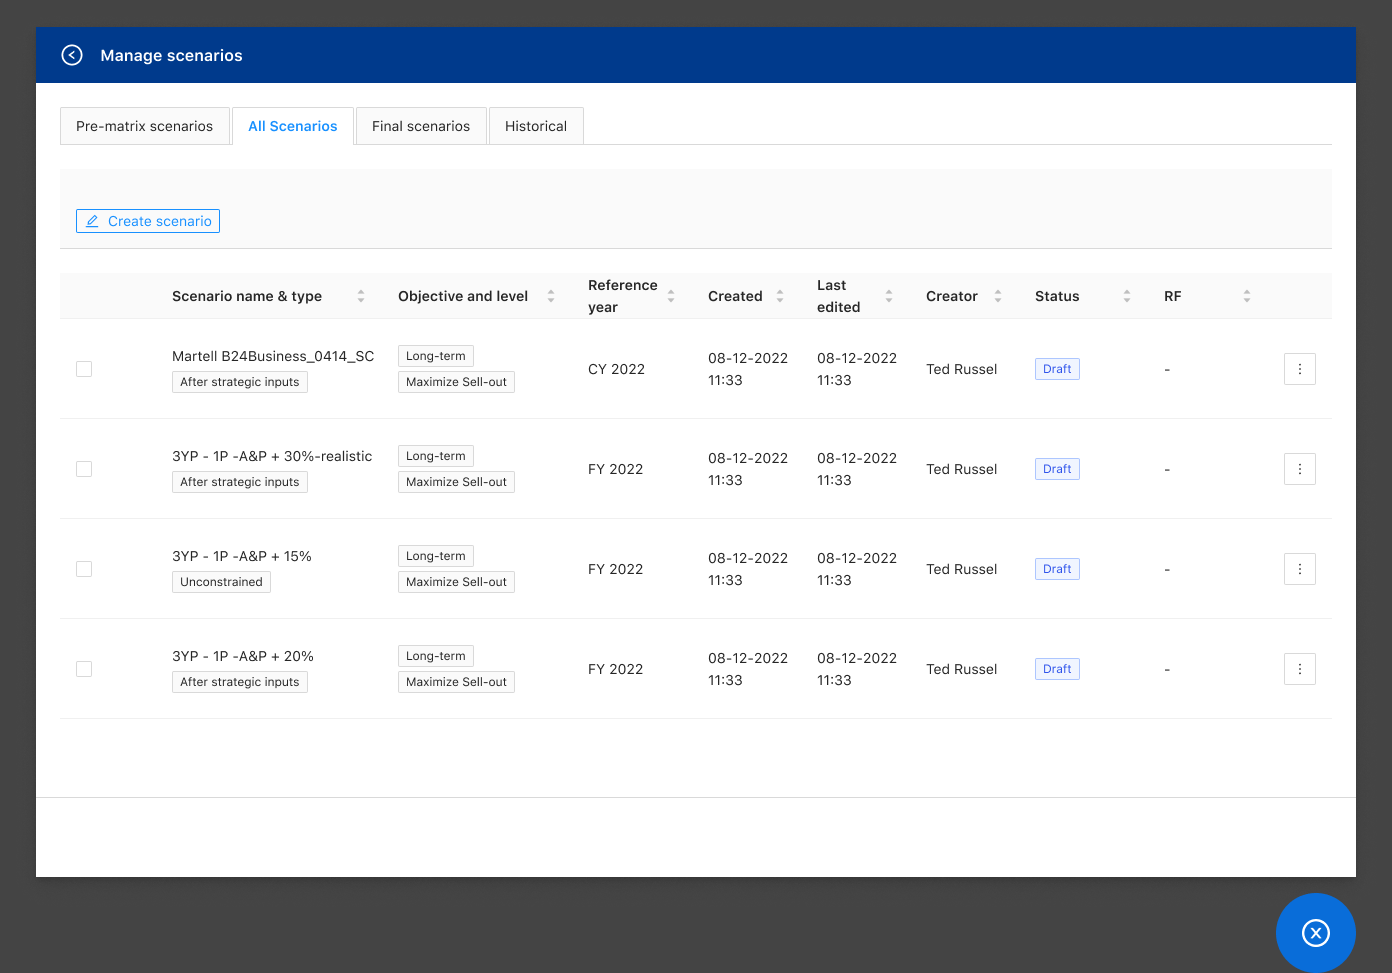
Scenarios had to be easy to set up, compare and finalise.
In the control tower, scenarios are listed with their type, objective, reference year and status. From one row, a scenario can be linked to a rolling forecast, set as final, duplicated or edited, and its inputs open in a side panel.
Expert users still need hierarchy.
Designing for specialists does not mean making the interface complicated. It means knowing what they need immediately, and what they can open when they are ready.